ECR feature: Joshua Hallas on the influence of historical biogeography and current environmental variation on patterns of genetic diversity.

Joshua Hallas is a PhD student at the University of Nevada in the USA. He is an evolutionary biologist interested in how environmental variation and natural histories mediate population structure, local adaptation, and genetic differentiation through time. Here, Joshua shares his recent work on the population genetics of the Western terrestrial garter snake.

Joshua Hallas during field collecting in Namibia, Africa.

Personal links. Personal website | Twitter

Institute. University of Nevada, Reno; Department of Biology and Graduate Program in Ecology, Evolution, and Conservation Biology

Academic life stage. PhD student

Major research themes. My research interests mainly focus on incorporating phylogenomic and population genomic techniques to understand how environmental variation and natural histories mediate population structure, local adaptation, and genetic differentiation through time.
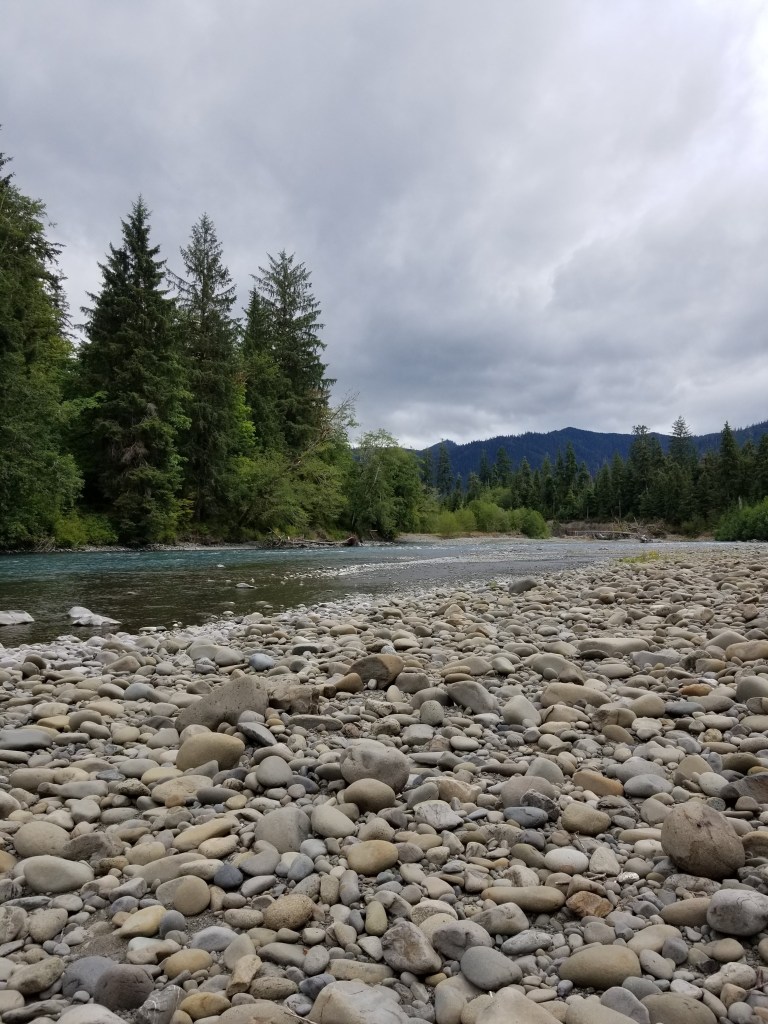
Queets River at Olympic National Park.

Current study system. Thamnophis (garter snakes) are an ecologically and morphologically diverse group of North American colubrids (“harmless snakes”). For decades, this group has been used as a model to better understand numerous ecological and evolutionary processes (e.g., behaviour, coevolution, feeding ecology). Among Thamnophis, the western terrestrial garter snake (T. elegans) is one of the most ecologically variable and well-studied species in the genus whose range encompasses much of western North American. Even though T. elegans is primarily associated with aquatic habitat types, the species occupies a broad array of environments that include coastal rainforests, alpine communities, and high deserts, which makes it ideal to examine the influence of landscapes on genetic differentiation.

Recent JBI paper. Hallas, J.M., Parchman, T.L. and Feldman, C.R., 2021. The influence of history, geography and environment on patterns of diversification in the western terrestrial garter snake. Journal of Biogeography, 48(9): 2226-2245 https://doi.org/10.1111/jbi.14146

Thamnophis sirtalis at Olympic National Park – Queets River.

Motivation behind this paper. I have always been captivated by the landscapes and species richness of western North America. The region, which includes the California Floristic Province (a biodiversity hotspot), has a complex geological history that includes ancient marine embayments, multiple mountain ranges, volcanic activity, and has been repeatedly subjected to glacial cycles. Moreover, it comprises a variety of environments that may also play a role in patterns of differentiation. Biogeographic studies of herpetofauna throughout this region have recovered highly congruent patterns of differentiation associated with these features (e.g., Central Valley and Sacramento – San Joaquin River Delta). We decided to take advantage of the vast distribution and pronounced ecological diversity of T. elegans to test previous biogeographic hypotheses focused on western North America. We also took this opportunity to re-examine phylogenetic estimates surrounding the subspecies that comprise T. elegans.

Preserved specimen of Thamnophis elegans from the Herpetology collection at the California Academy of Sciences.

Key methodologies. We used a reduced representation double-digest RADseq (ddRADseq) approach. This technique allowed us to generate copious amounts of sequence data needed to characterize fine-scale spatial structure among and within each subspecies.  Employing both population genetic and phylogenetic methods, we were able to investigate patterns of variation at multiple spatial scales and levels of differentiation. In conjunction with phylogenetic and ancestral area reconstruction analyses, we used EEMS (estimated effective migration surface) and genetic-environment association analyses (GEA). The EEMS analysis allowed us to test if geological features coincided with estimated areas of low migration, and the GEA was used to identify signatures of natural selection to environmental variables.

Prepping Namanazours jordani for following graduate student Jonathan Deboer – Namibia, Africa.

Unexpected challenges. An unexpected challenged that we encountered was incorporating multiple complex stories into a single cohesive biogeographic conclusion. This was mainly a result of having among and within subspecies datasets. Our analyses among subspecies gave great insight into dispersal and patterns of diversification. Unfortunately, we were only able to conduct within subspecies analyses for T. e. elegans and T. e. terrestris because we lacked the sampling for T. e. vagrans. Nevertheless, our population genetic analyses of T. e. elegans and T. e. terrestris allowed us to better understand the roles of both isolation-by-distance and population fragmentation driving genetic differentiation. This also meant we had differing explanations for the biogeographic patterns we observed in these two subspecies. Even though this complicated the writing process, I think it made our study more fulfilling and impactful.

Canopy from Redwood State and National Parks.

Major results. We recovered both broad and fine-scale geographic patterns in T. elegans associated with biogeographic features across western North America. For example, Central Valley, marine embayments, and Sacramento – San Joaquin River Delta, and possibly the Snake River Plain or Wyoming Basin are breaks and potential barriers to gene flow. We also detected non-neutral patterns of genetic variation associated with environmental variation (especially mean annual temperature, isothermality, total annual precipitation) in our GEA analyses for T. e. elegans and T. e. terrestris. This suggests that differentiation of these subspecies is jointly shaped by landscape features and environmental variables. Surprisingly, we also recovered signatures of possible admixture between T. e. elegans and T. e. terrestris where their ranges intersect in northwestern California. Conversely, we found no evidence between T. e. elegans and T. e. vagrans, even though their ranges intersect along northeastern California and southern Oregon. Our findings greatly improve the understanding of diversification across multiple spatial scales throughout western North America.
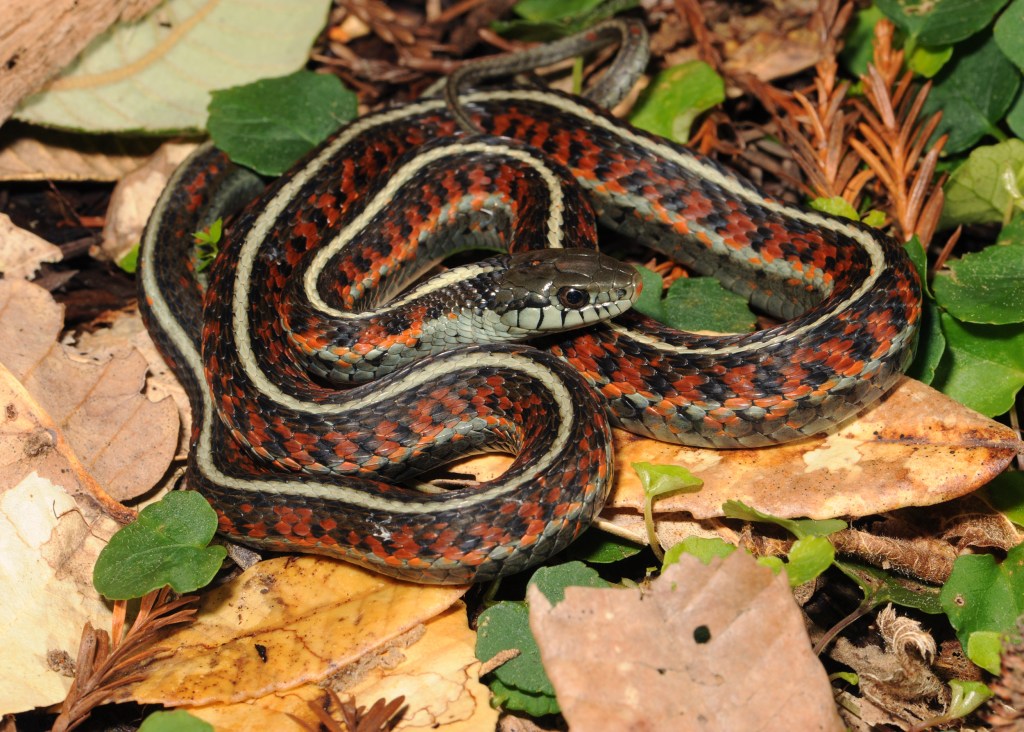
Photo of Thamnophis elegans terrestris from San Mateo county California (photo by Robert Hansen).

Next steps for this research. Some questions I would like to explore further would focus on the biogeographic patterns in T. e. vagrans, which has the largest range of the three subspecies. Our current analyses suggest some interesting patterns that divide the subspecies into two clades that represent the Pacific Northwest and the arid Southwest. Finer-scale work on T. e. vagrans would also fill in a knowledge gap regarding the influence of features like the Rocky Mountains, Colorado Plateau, and Columbia Plateau on patterns of diversification. The admixture we recovered between T. e. elegans and T. e. terrestris also warrants further investigation. However, increased genomic and specimen sampling would be needed to understand the genomic consequences of admixture.
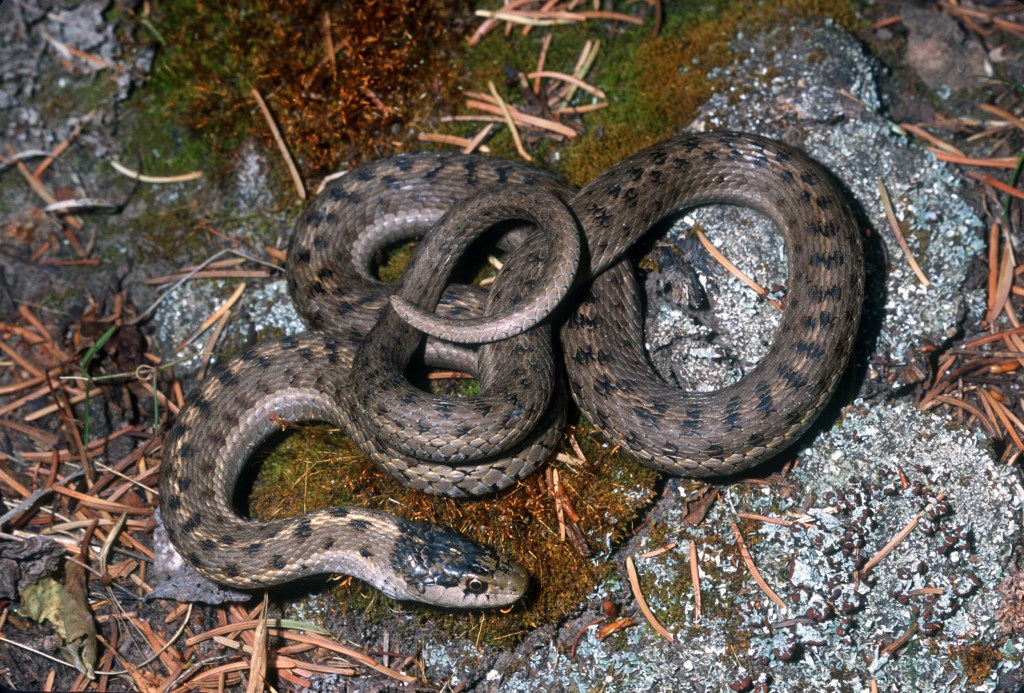
Photo of Thamnophis elegans vagrans (photo by Robert Hansen).

If you could study any organism on Earth, what would it be? I thoroughly enjoy using garter snakes (Thamnophis) to investigate evolutionary questions. This group of organisms has been very influential in my research career and my interest in reptiles. They were one of the most common species I would catch in my youth, and it’s been a joy to work with them in a more academic and professional setting.

Educational outreach event at the University of Nevada Reno Natural History Museum.  Showing the arboreal ability of my Morelia spilota.

Anything else to add? Much of my enthusiasm for the natural world was fostered during family trips to California National Parks. Also, probably why I started collecting Junior Ranger badges. However, during these trips, my father would encourage my siblings and I to explore the outdoors. I was not only captivated by the overwhelming landscapes but also the ecological and evolutionary patterns I would observe. These experiences helped me develop my aspirations of conducting scientific research and learned the value of asking questions. This is why I am very passionate about scientific outreach and hands-on learning. I believe curiosity can’t be taught, and that it could only be nurtured. It is up to current researchers to help encourage future generations to continue to ask questions.


Latitudinal gradient of host breadths in herbivorous butterflies

The combination of accumulated occurrence data and host use records across Japan revealed that the fundamental resource specialization of butterfly communities becomes more specialized toward higher latitudes.

Above: Japonica lutea is a butterfly species widely distributed in Japan. Photograph by Ryosuke Nakadai.

Are host breadths of herbivorous insects more specialized in the tropics compared to higher latitudes? This question is based on MacArthur’s (1972) latitude–niche breadth hypothesis, in which niche breadth is positively associated with latitude. To answer the long-standing question, many previous studies have compared host breadth patterns between temperate regions and the tropics but the results have been mixed and gradually the hypothesis has become highly controversial. The original hypothesis and following empirical studies have targeted “realized” host breadths, although processes constructing realized patterns in nature can be very complex due to local interspecific interactions. Here, we aimed to focus on the underlying “fundamental” host breadth, hoping it could facilitate our understanding of the processes driving variation in the degree of resource specialization without considering the complicated effects of local interspecific interactions.

Cover image article: (Free to read online for a year.)
Nakadai, R., Nyman, T., Hashimoto, K., Iwasaki, T., & Valtonen, A. (2021). Fundamental resource specialization of herbivorous butterflies decreases towards lower latitudes. Journal of Biogeography, 48, 2524–2537. https://doi.org/10.1111/jbi.14218

To evaluate the fundamental host breadth, we used two types of accumulated datasets across Japan; occurrence data and host use records. Based on those datasets, the fundamental host breadth was calculated in each grid cell (about 10 km × 10 km). In addition, we considered several factors which potentially affect the host breadth pattern, specifically climate, geography, and butterfly body size. To our surprise, we found that the fundamental host breadths of butterflies increase toward lower latitudes, which is opposed to the classical prediction based on the latitudinal gradient of realized host breadths. Also, the pattern seems to be mainly driven by climate, especially annual mean temperature.

In the article, we only focused on the fundamental host breadths as the pattern of realized host breadths were unknown in this region. The pattern of realized host breadth could correlate positively, negatively, or it could not correlate with the latitude. In theory, the patterns of realized host breadth could simply reflect the pattern observed in the fundamental host breadths, or the local processes could construct a ­reverse latitudinal trend against fundamental host breadth. To test these possible outcomes is one of the missing pieces in this article. Furthermore, we emphasize that the approach used in the evaluation of fundamental host breadth is applicable to many other areas and taxa for which reliable information on species occurrences and niches is available. The continuous improvement in open-access databases on species distributions and host use will hopefully eventually allow the testing of patterns of fundamental resource specialization on a global scale.

Reference
MacArthur, R. H. (1972). Geographical ecology: Patterns in the distribution of species. Princeton University Press.

Written by:
Ryosuke Nakadai (1), Anu Valtonen (2)
(1) Research Associate, Biodiversity Division, National Institute for Environmental Studies
(2) Senior Researcher, Faculty of Science and Forestry, Department of Environmental and Biological Sciences, University of Eastern Finland

Additional information:
https://sites.google.com/site/nakadairyosuke/english
https://uefconnect.uef.fi/en/person/anu.valtonen/

ECR feature: Mekala Sundaram on the climatic influence of conifers biodiversity

Mekala Sundaram is a postdoc at the University of Georgia in the USA. She is an ecologist interested in unveiling macroecological patterns. Here, Mekala shares her recent work on the influence of current and past climate on the global biodiversity of conifers.

Mekala Sundaram is an ecologist working on the global diversity of conifers.

Personal links. Research Gate

Institute. Center for Ecology of Infectious Diseases, University of Georgia

Academic life stage. Postdoc

Major research themes. Species occurrence, Community assembly and Macroecology

Current study system. My recent research focuses on understanding how conifers are distributed across the globe, where biodiversity hotspots occur, and where they may be expected to occur in the future under different climate change scenarios. Conifers are an interesting study system because there are over 600 species globally that occur in a wide variety of biomes, from tropical forests to boreal biomes. Conifers are also an ancient taxonomic group, first appearing in the fossil record in the Carboniferous period (~300 million years ago).

Recent JBI paper. Sundaram, M., & Leslie, A. B. (2021). The influence of climate and palaeoclimate on distributions of global conifer clades depends on geographical range size. Journal of Biogeography, 48(9): 2286-2297 https://doi.org/10.1111/jbi.14152

Motivation behind this paper. In this paper, we explore the reasons underlying conifers’ distributions. As conifers are an old lineage, current distributions of conifers may be related to current climate patterns or could result from past climatic responses. Regions with stable past climates are hypothesized to be refugia for conifer biodiversity. Therefore, we tested if restricted conifers occur in areas with stable past climates when compared to widespread conifers.

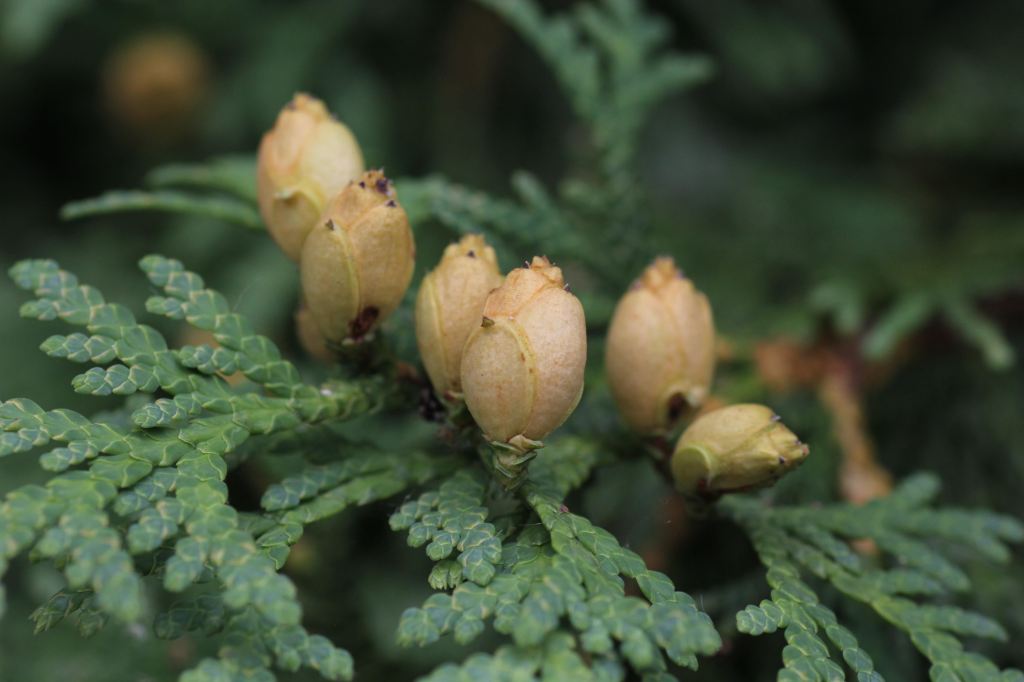
Thuja occidentalis is a widespread conifer found in North America (Photo credit: Dr. Andrew Leslie).

Key methodologies. We gathered geographic ranges of conifers from previous works, modern climate information, and GIS layers of past climates reconstructions for the last 2 million years. We used a novel modelling framework of zeta diversity to disentangle which climate variables explain distributions of restricted conifers versus distributions of widespread conifers. We also employ ensemble species distribution modelling methods to further explore how climate drivers explain distributions of widespread and range-restricted conifers. Both modelling methods provide robust and consistent conclusions.

Unexpected challenges. We faced some computational challenges while analyzing the global distributions of 606 conifer species! Quantitatively combining distributions of 606 species with climate layers in an ensemble modelling framework required lots of computational memory. Also, gathering past climate records from the last 2 million years was difficult, as reconstructing past climates for the entire globe is a challenging endeavour by its nature. To solve the computational problems, we were able to break down modelling into smaller pieces to be completed separately. For past climate information, we were able to gather suitable datasets after an extensive search for paleoclimate records.

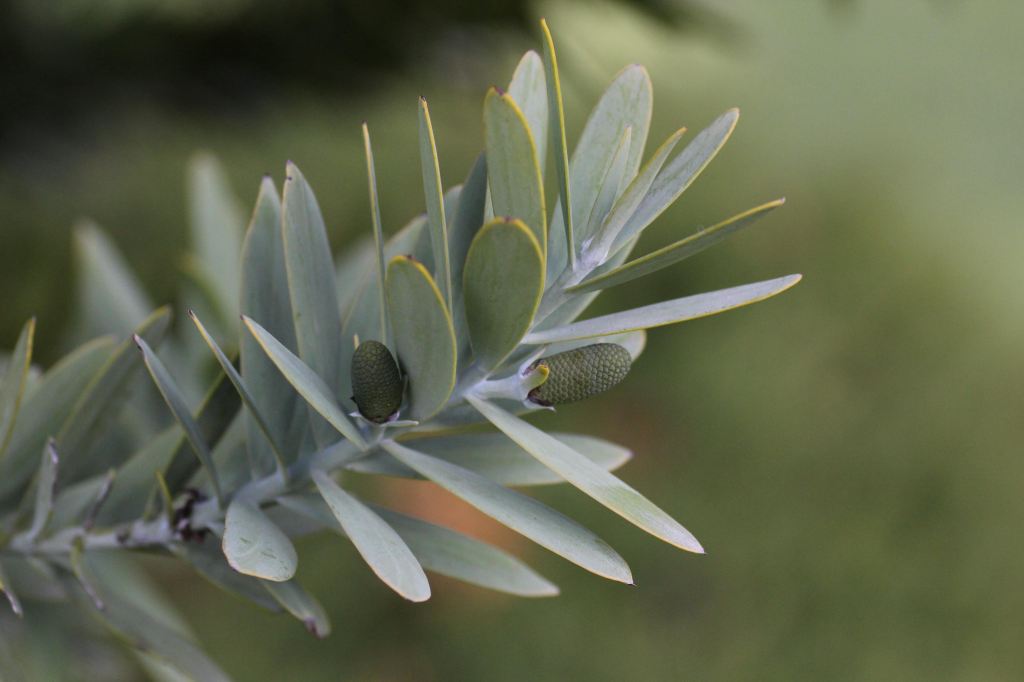
Agathis australis is a restricted conifer found in New Zealand, but this specimen was photographed in the Christchurch Botanic Gardens (Photo credit: Dr. Andrew Leslie).

Major results. Our paper advances the field as we directly test how climate patterns from the last 2 million years influence the distributions of a major plant group nowadays. We conclude that geographically restricted conifers are best predicted by past climate patterns, meaning that fluctuations in climate over the last 2 million years have led to some species being restricted in refugial areas or places that have experienced relatively stable climates. Meanwhile, the more widespread conifers are best predicted by modern climates, with several large range species occupying regions with inhospitable climates. Conifer biodiversity hotspots occur in refugial areas where range-restricted species tend to occur, therefore, historical climate patterns may play a role in the formation of these biodiversity hotspots. Our unique methodological approaches have allowed us to disentangle how past climates influence distributions of conifers of different geographic range sizes. These findings and methods have allowed us to test long-standing theories on how plants are distributed and how biodiversity hotspots are formed.

Next steps for this research. The next step is to ask whether species restricted to stable refugial areas are likely to survive in the future. Under a warming climate, species currently restricted to climatically stable biodiversity hotspot regions may be threatened in the future. Therefore, field and modelling studies are needed to test whether taxa can survive under future climate conditions.

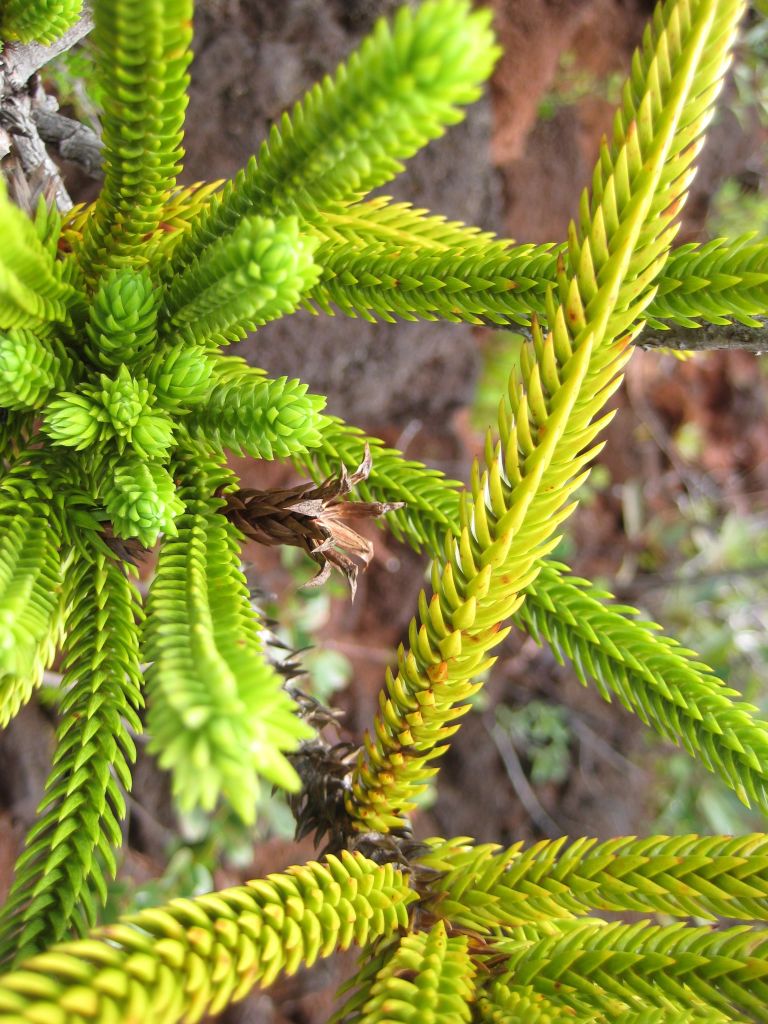
Callitris pancheri is a restricted conifer endemic to New Caledonia (Photo credit: Dr. Andrew Leslie).

If you could study any organism on Earth, what would it be? I would like to study a rare species that very little is known about or a non-charismatic species that gets little attention, e.g., aardvark or the rare Wollemia nobilis conifer.

Anything else to add? I have recently switched from studying conifers to studying infectious disease outbreaks to shed light on how humans’ interaction with biodiversity might lead to infectious disease outbreaks. With the ongoing pandemic, there has been great interest in studying how biodiversity should be conserved and understanding how to maintain a healthy environment that minimizes the risk of disease transmission. I am now using methods similar to those described in the conifer paper to examine how biodiversity relates to infectious disease outbreaks.

Award highlight: Connecting the past with the present

A paper describing two centuries of changes in crop regions is awarded the Humboldt-Caldas medal 2021 for best biogeography paper in Colombia/Ecuador.

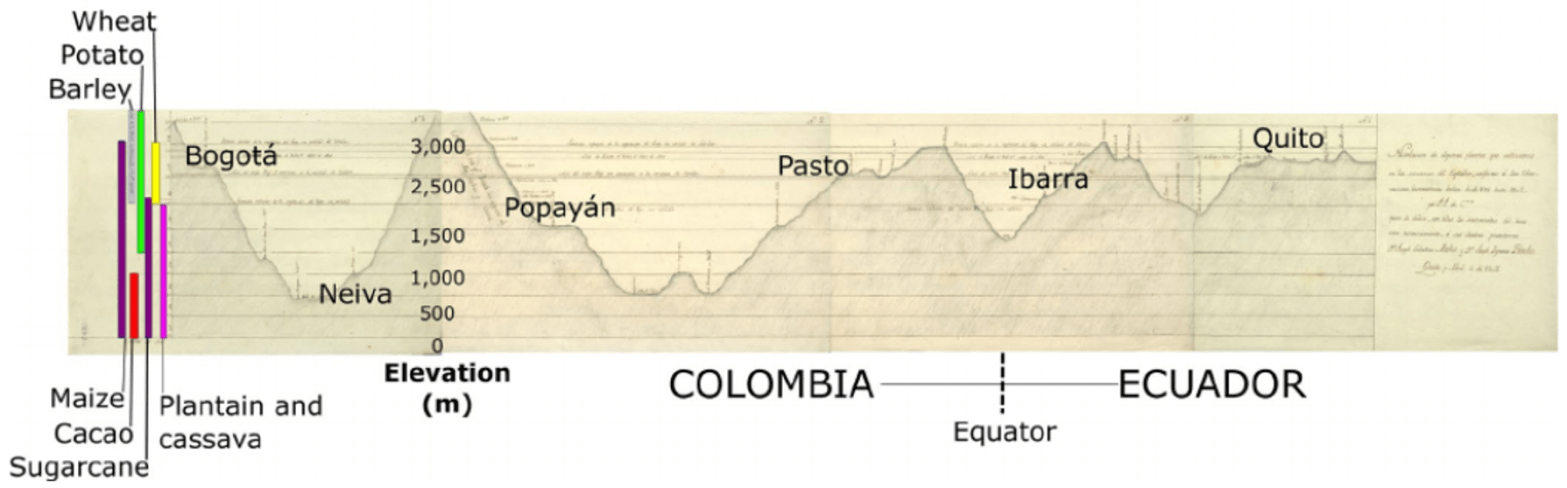
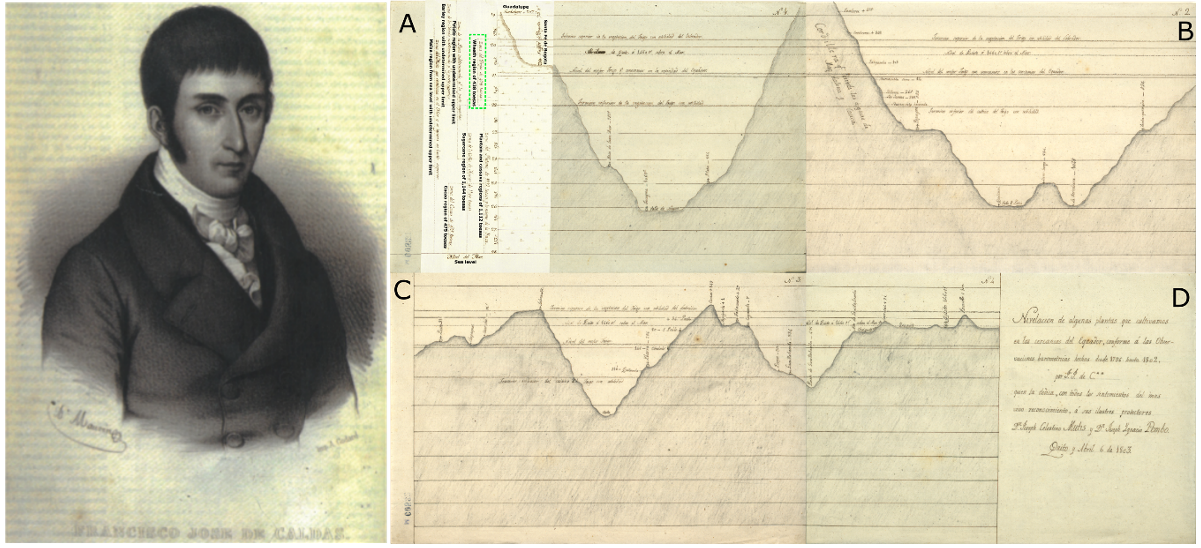
Above: Original cartography of Caldas’ crop regions showing the colonial profile of the travel route with vertical elevations, towns and the different crops Ali Salim.

Ever since I began studying plant biology, I have been fascinated with the life and work of Francisco Jose de Caldas who was born and raised in my hometown of Popayan, Colombia. This paper identifies the changes of crop distribution of eight staple crops (cacao, maize, plantain, cassava, wheat, barley, sugar cane and potato) over 224 years, in relation to latitude and elevation. Using Caldas’ map of crop regions created between 1796 and 1803, we compared these regions with a replicated map of the same regions today.  The challenge of our work was developing a dataset that accurately matched the location of crops from more than 200 years ago. We were especially surprised to see such a substantial change of 740 meters in the elevational range.

Read the article: (Free to read online for 2 months.)
González-Orozco, C.E., Porcel, M. (2021). Two centuries of changes in Andean crop distribution. J Biogeogr. https://onlinelibrary.wiley.com/doi/epdf/10.1111/jbi.14126  


Above left: Portrait of Francisco José de Caldas (1768–1816), the father of plant geography in Latin America. Portrait painted by Antoine Maurin (1793–1860) and printed by Armand Godar (publication date unknown; in Museo Nacional de Colombia, 2002). Above right: Caldasʾ crop regions map ordered latitudinally (A-D) from Bogota (Colombia) to Quito (Ecuador). Images authorized and obtained from the Archive of the Royal Botanic Garden. AJB, Div. III, M519, M520, M521 and M522.

This study also aims to raise awareness of the significant contribution Caldas has made to biogeography and agriculture. Caldas was a self-learned scientist who came from humble beginnings with little resources compared to European naturalists of his time. Despite this, he developed a deep understanding of plant geography in this region.  We provide evidence to conclude that Caldas’ work on climate and agriculture was essential to developing the field of tropical agriculture climatology, a discipline that Caldas established but for which he was never given recognition. 

For this reason, we are delighted that our paper is awarded the Humboldt-Caldas medal in 2021 which is granted every two years by the Colombian Academy of Science and the Embassy of Germany in Colombia, to the best biogeography paper published in Colombia and Ecuador. We are honoured to receive the award and grateful that we were able to publish our paper in the Journal of Biogeography. Documenting Caldas’ work is an ongoing task being undertaken by Colombian academics who are studying his recently repatriated manuscripts from Europe. This work offers exciting new discoveries of both his scientific contribution and involvement in Colombia’s independence from Spain, which in the end cost him his life.


Above: An image of the medal with Humboldt and Caldas portraits.

Written by:
Carlos Eduardo González-Orozco and Mario Porcel
Corporación Colombiana de Investigación Agropecuaria (AGROSAVIA), Centro de Investigación La Libertad – km 14 vía Puerto López, Villavicencio, Meta, Colombia

Time waits for no one, except in cities

‘Change is the only constant in life’ and in the Anthropocene the nature of change is being altered too. Though we often associate human activities with increasing rates, a new study of urbanization shows that in some places we are in effect slowing down time instead.

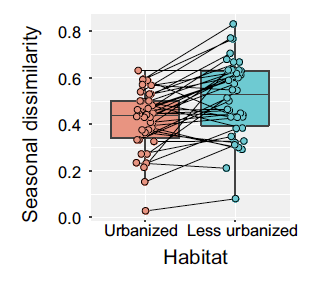
Above: Seasonal dissimilarity of bird community composition in urbanized and less urbanized areas across several continents.

The urban population is increasing, promoting an expansion of cities and urban densification. Therefore, to know how these processes affect biodiversity in urban areas is fundamental to designing more sustainable cities. But, what is biodiversity? The number of species that can be found in a site is the alpha diversity, and this type of diversity has been predominantly analyzed in urban ecology. Another type of biodiversity is the change of species composition between sites, or spatial beta diversity. Therefore, if two sites do not share species, between them there is high beta diversity. Spatial beta diversity has been analyzed in urban ecology, regarding the biotic homogenization phenomenon (McKinney 2006). Biotic homogenization is the increased similarity of two sites over time, associated with the colonization of widespread species in urban areas. A third type of biodiversity is the change in species composition over time in a site, or temporal beta diversity. Seasonal or interannual changes of species are examples of temporal beta diversity. This type of beta diversity has been much less studied in urban ecology.

Editors’ Choice article: (Free to read online for a year.)
Leveau, L. M., Jokimäki, J., & Kaisanlahti-Jokimäki, M. L. (2021). Urbanization buffers seasonal change in composition of bird communities: A multi-continental meta-analysis. Journal of Biogeography 48: https://onlinelibrary.wiley.com/doi/10.1111/jbi.14236 

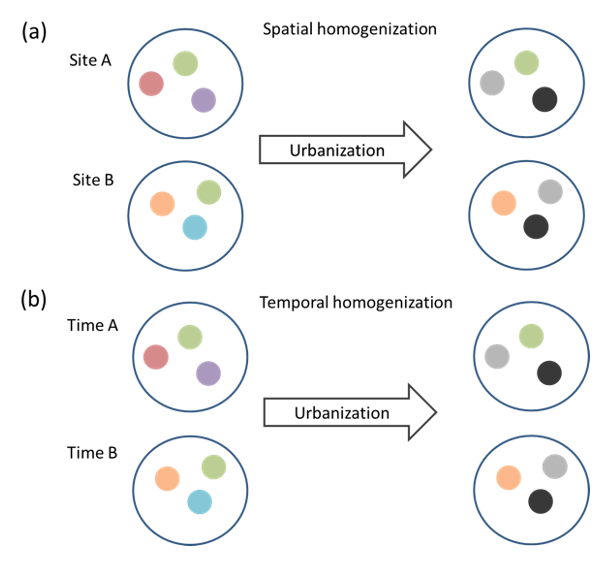
Due to urban areas seeming to stabilize the temporal variation of resources and habitat structure for birds, the temporal beta diversity may be reduced in cities. When I started to write a review about the temporal stabilization of resources for birds in urban areas, I realized that the biotic homogenization may have a spatial and a temporal component (Leveau 2018). The similar conditions of urban areas located in different biomes may promote the colonization of similar widespread species, increasing the spatial homogenization of biotas (Figure 1a). On the other hand, the similar conditions over time in a city may promote a temporal persistence of species compared to non-urban areas, increasing the temporal homogenization of biotas (Figure 1b).

The temporal homogenization has different scales: day/night, week/weekend, seasonal and interannual. Because I realized that several studies regarding the seasonal scale have been published worldwide, I decided to analyze global patterns with my colleagues Jukka Jokimäki and Marja-Liisa Kaisanlahti-Jokimäki. The large-scale patterns of climate seasonality give us the opportunity to answer two questions. (1) Is the seasonal homogenization of urban avifaunas a global phenomenon? 2) Does the degree of seasonal homogenization vary according to latitude or other large-scale variables?.


Schematic diagram showing the processes of spatial and temporal homogenization of biotas. The spatial homogenization (a) occurs when two sites become more similar in species composition (circles of different colors) due to urbanization. The temporal homogenization (b) occurs when the temporal variation of composition in a site is reduced due to urbanization.

We found that the seasonal homogenization of avifaunas was higher in those cities near the poles and in cold regions. Avifaunas in natural areas near the poles are dominated by migratory species. Thus, their seasonality is higher than avifaunas in tropical regions. As a result, the contrast between the seasonal change in urban areas and natural or rural areas is the highest near the poles. Another interesting finding was that the seasonal change of bird composition is higher in urban than in natural areas near the Equator. A case study from Belém (Brazil, 1°27′S; Lees et al. 2017) reflects our results. The authors found that the proportion of migrant bird species in the city was over-represented in comparison with the regional pool of species.

We also explored the effect of hemisphere and study design. We found that the seasonal homogenization of urban avifaunas was more pronounced in the Northern Hemisphere. This pattern could be related to several factors, such as the higher proportion of migrant birds or a more stabilization of resources in urban areas in the Northern Hemisphere. On one hand, we found a significant dampening of urban bird composition seasonality in those studies that compared urban versus rural or natural areas. On the other hand, studies that compared green areas in different urban contexts did not show differences in bird composition seasonality. This result suggests that urban green areas are refuges for migrant birds and can sustain part of the temporal beta diversity of the region.

Finally, I would like to thank all the colleagues that generously shared their valuable data with us: Dan Chamberlain, Mohan Kukreti, Gabor Lövei, Maria Dolores Juri, Nélida Villaseñor, Bibhu Panda, Neeraj Sharma and Gerardo Linares Hernándeza.

Written by:
Lucas Leveau, PhD, Departamento de Ecología, Genética y Evolución, Facultad de Ciencias Exactas y Naturales, Universidad de Buenos Aires – IEGEBA (CONICET – UBA), Ciudad Universitaria, Pab 2, Piso 4, Buenos Aires 1426, Argentina

Additional information:
https://twitter.com/LucasLeveau
https://www.researchgate.net/profile/Lucas-Leveau

Lees, A. C., & Moura, N. G. (2017). Taxonomic, phylogenetic and functional diversity of an urban Amazonian avifauna. Urban Ecosystems, 20(5), 1019-1025.

Leveau, L. M. (2018). Urbanization, environmental stabilization and temporal persistence of bird species: a view from Latin America. PeerJ, 6, e6056.

McKinney, M. L. (2006). Urbanization as a major cause of biotic homogenization. Biological conservation, 127(3), 247-260.

Pool diversity shapes unique island communities

Compiling a new island dataset enables a global perspective on the unique diversity of the smallest communities.

Above: A group of small islands Pianemo, Raja Ampat, Indonesia. Like many before us, we studied island systems to better understand the drivers community composition.  Photo by Sutirta Budiman on Unsplash.

Island biogeography is one of the most iconic, foundational areas of ecological research. With their clear boundaries and convenient spatial arrangements, islands have historically been used to better understand evolution, species richness, the distribution of certain species traits, among others. I’ve always loved reading island biogeography articles for this very reason: islands are natural “test tubes” that provide unique opportunities to elegantly answer questions about how biodiversity is developed and maintained through time, and in different places.

Cover image article: (Free to read online for a year.)
Hébert, K., Millien, V. and Lessard, J.-P. (2021), Source pool diversity and proximity shape the compositional uniqueness of insular mammal assemblages worldwide. J Biogeogr. https://doi.org/10.1111/jbi.14156oi.org/10.1111/jbi.14070 

Our paper is no exception: we use islands to delve into the processes that shape mammal communities, like selection, dispersal, and stochasticity. We also take advantage of the diversity of islands worldwide in an attempt to uncover some global-scale generality in the driving forces shaping ecological communities on islands. This “zoomed out” look at how different regions differed in the processes that shape their local communities is the most exciting part of our paper (to me!). Because of this, we were able to ask whether communities differ according to their “source pool”, which is all the species in a broad region that are able to get to, and live in, a given habitat, at a global scale – a question that has remained challenging to answer empirically because it is so difficult to sample many regions in one study. Thanks to range maps published by the International Union for Conservation of Nature, we were able to construct source pools for each of the nine island systems to see how the regions varied in their diversity. We also took this a step further and built source pools for each of the 206 islands in our dataset, which showcased the exceptionally high mammal diversity in South-East Asia (some islands have more than 500 species in their source pool!) which contributes to the unique communities we observed. Inferring these local and regional source pools allowed us to ask our questions at both scales, which is not usually accessible to many ecological studies.

Using these pools, we found that both the composition and the proximity to the source pool have a strong influence on the composition of mammal communities on islands worldwide. When islands are further from their source pool (such as the other landmasses surrounding them, or the mainland), their mammal communities tend to be more phylogenetically ‘unique’, especially if this source pool is phylogenetically diverse. In other words, island communities tend to include species from more unique evolutionary lineages if they are isolated and in a highly biodiverse region.


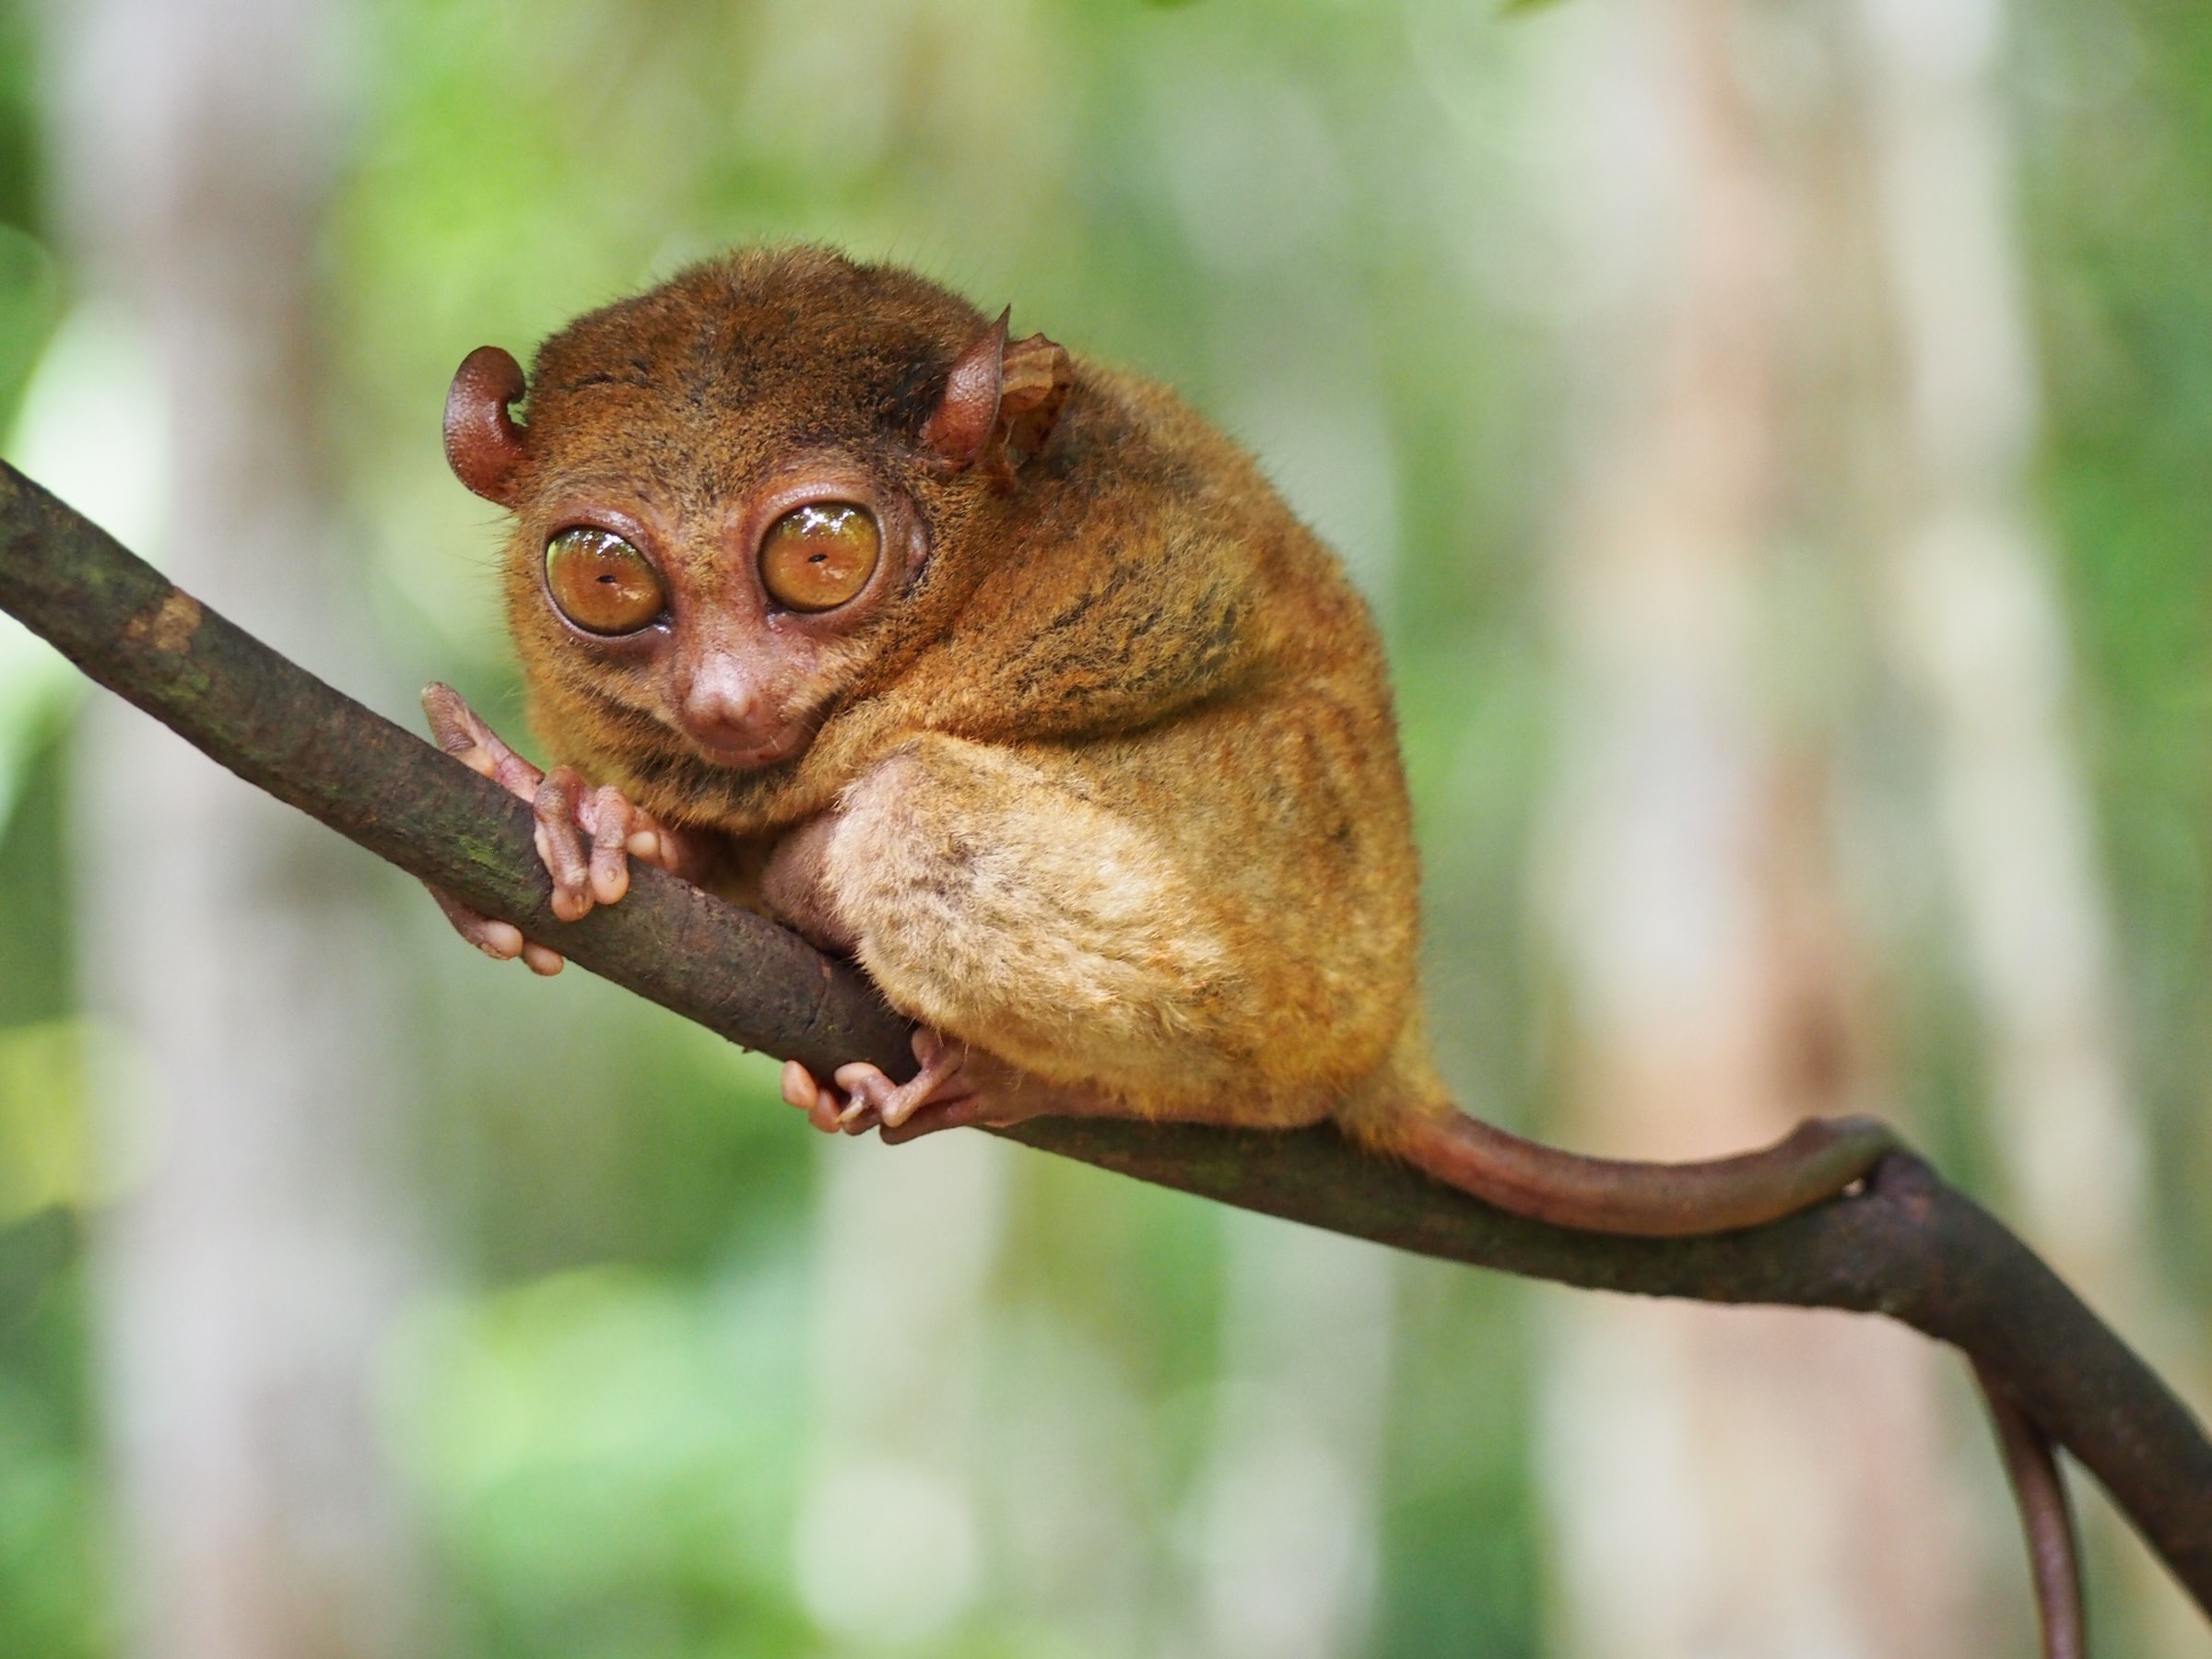
The Philippine tarsier (Carlito syrichta) is endemic to the Philippines, contributing to the unique phylogenetic composition of the insular mammal communities we observed in this region. Photo by Deb Dowd on Unsplash.

Although island biodiversity is often studied, it can actually be quite difficult to find occurrence data for entire island communities, even for one of the most beloved groups: mammals! Although we had some data from Virginie’s previous work on mammal body size on islands, we quickly realised we would have to expand on these data to build a multi-region island community dataset if we wanted to answer the questions we wanted to explore. So, I spent months scanning the literature and flipping through atlases and checklists to build a portrait of mammal community composition for several other island systems across the world. The result is a dataset of mammal community composition for about 200 islands in nine archipelagos around the world (which is available at https://doi.org/10.5061/dryad.rfj6q579r). It has incredible potential for ecological research including community ecology, island biogeography, and conservation biology, and we hope the dataset can be used to answer many other questions about the ecological world in the future.

Written by:
Katherine Hébert
PhD candidate, Department of Biology, Université de Sherbrooke, 2500 Bd de l’Université, Sherbrooke, QC J1K 2R1

Additional information:
@hebert_kat
GitHub: github.com/katherinehebert

ECR Feature: Isabel Haro-Bilbao & Josh Thia on the use of genomics to identify fisheries stocks

Isabel Haro-Bilbao and Josh Thia met while completing their PhD’s at the University of Queensland, Australia. Both had interests in the ecology of marine organisms, which led them to collaborate on a project investigating genetic differentiation in the wahoo, a large, highly dispersive pelagic fish. Isabel and Josh share how they used population genomic approaches to characterise previously unidentified stocks in this important species of recreational, subsistent and commercial fisheries.

(left) Isabel in Santa Barbera while attending a tuna conference and catching up with coauthor, John Baldwin, to get wahoo samples. (right) Josh out surveying experimental plots in rural Australia for agricultural pests (sporting his signature field work bucket hat).

Personal links. [Josh]: Twitter | Webpage | Google Scholar | ResearchGate

Institute. [Isabel]: The University of Queensland. [Josh]: The University of Melbourne.

Career life stage. [Isabel]: Masters of Economics. [Josh]: Postdoc.

Major research themes.

[Isabel]: I am currently completing a master’s degree in economics, and my interest focuses on multidisciplinary small-scale fisheries management that combines ecology and economics. I aim to find tailored solutions for sustainable fisheries that balance the environmental, social, and economic impacts.

[Josh]: My current main research focus is on arthropod pests of Australian agriculture, specifically with respect to the molecular mechanisms and evolution of pesticide resistance. However, I am interested in all sorts of organisms and systems, including the wonders of the wet and watery ocean!

Recent paper in JBI. Haro‐Bilbao, Isabel, Riginos, Cynthia, Baldwin, John D., Zischke, Mitchell, Tibbetts, Ian R., Thia, Joshua A. (2021). Global connections with some genomic differentiation occur between Indo‐Pacific and Atlantic Ocean wahoo, a large circumtropical pelagic fish. Journal of Biogeography 

DOI: https://doi.org/10.1111/jbi.14135

Wiley Content Link: https://onlinelibrary.wiley.com/share/author/KQBXQ77KD7EUBYPEUPEM?target=10.1111/jbi.14135

Motivation behind this paper. This paper was birthed as a collaboration during our respective PhDs at the University of Queensland. We wanted to test the long-standing assumption that wahoo, Acanthocybium solandri, exist as a single, globally homogeneous population. Wahoo are an important fish in subsistent and recreational fisheries, are increasing in their commercial value, and there is a need to understand their stock structure for fisheries management. Like many large, pelagic fish, wahoo have extraordinary dispersal capacity and large population sizes. These factors have likely limited the ability of prior works to identify putative stocks, which have inferred genetic differentiation from a small number of genetic markers. We wanted to exploit population genomic techniques to increase our power to detect subtle genetic differentiation in a globally distributed sample of wahoo populations.

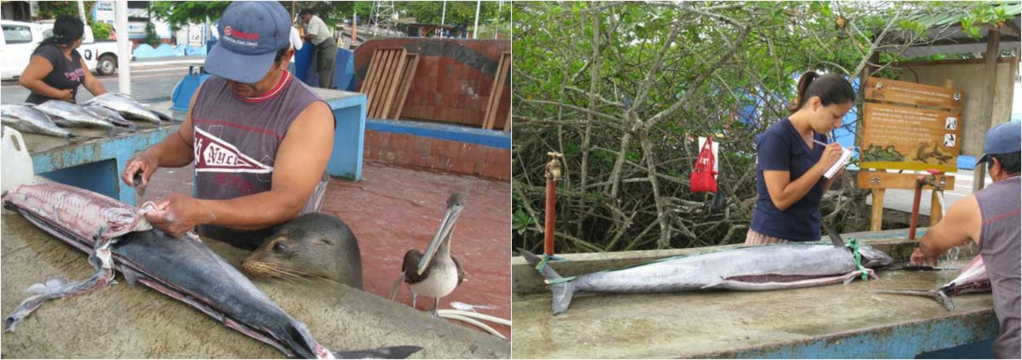
(left) A fisherman processing wahoo at a local market, Santa Cruz Island, Galapagos… he isn’t the only one with an interest in wahoo! (Photo credit: Jonathan Erazo) (right) Isabel taking notes at the fish market. (Photo credit: Jonathan Erazo)

Key methods. Our sampled wahoo populations spanned the Indo-Pacific and Atlantic Oceans. We tested for genetic differentiation between the Indo-Pacific and Atlantic, a well-known biogeographic break, and tested whether patterns of genetic differentiation were due to ongoing gene flow, low drift due to large population sizes, or a combination of both. We characterised genetic variation using single nucleotide polymorphisms (SNPs) obtained through a pooled reduced-representation (ezRAD) method. These SNPs were used to estimate genetic differentiation of populations across oceanic regions. We also used demographic analyses to test three population genetic scenarios: isolation with no gene flow, symmetric gene flow, and asymmetric gene flow. These scenarios were tested both within and between ocean basins to understand the spatial scales of gene flow.

Challenges overcame. One of the obvious financial and logistic challenges of a global study is obtaining samples representing as many sites as possible across the species distribution. Whilst Isabel had the opportunity to collect samples, we also pulled in samples from collaborations with Jonh Baldwin and Mitchell Zischke. Both had researched wahoo and had well-preserved, documented samples from across the globe, which were essential in our tests of inter-oceanic differentiation.

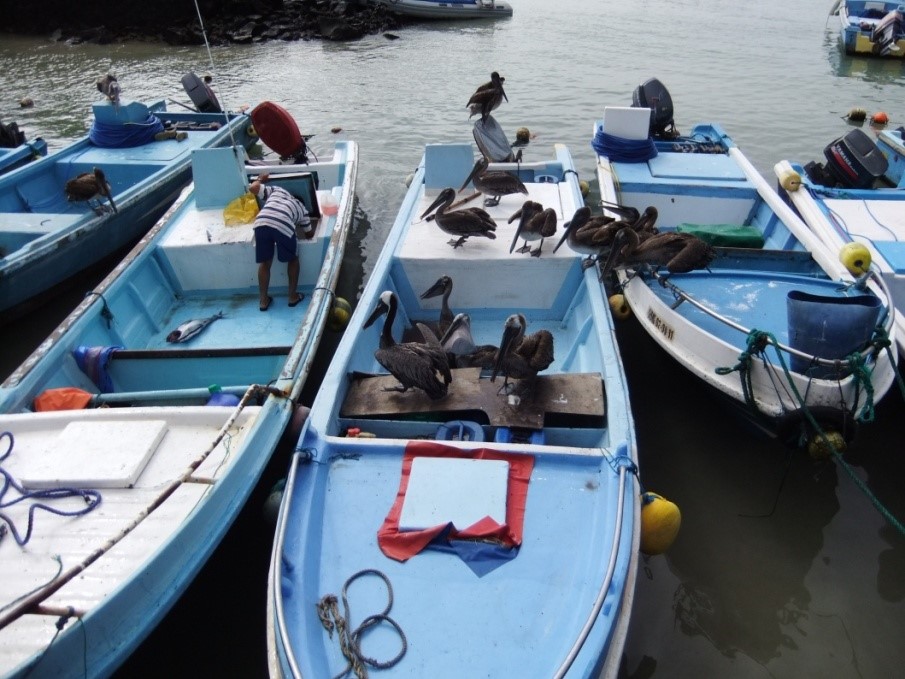
Fishing boats in Santa Cruz Island, Galapagos, adorned with pelicans. (Photo credit: Jonathan Erazo)

Major results. Our paper is the first to use genome-wide SNPs to examine genetic differentiation across the global distribution of wahoo. With the power of thousands of genomic markers, we debunked the previous hypothesis that wahoo is a single homogeneous population. We found that two discrete genetic stocks exist, one in the Indo-Pacific and one in the Atlantic. This regional structuring shows similarity to the yellowfin tuna, suggesting that similar forces may influence large, pelagic fish species. The genetic differentiation between ocean regions was subtle, and our demographic analyses indicated that this differentiation occurs against a background of high gene flow throughout the evolution history of wahoo. We did not find any clear support for asymmetric gene flow, as might be expected from other marine taxa that exhibit greater movement from the Indo-Pacific into the Atlantic. However, high dispersal and subtleties in genetic differentiation probably reduced our ability to identify asymmetries in gene flow.

Next steps. There are two major extensions of this work. Firstly, although we had great representation of the Atlantic and Indo-Pacific, we did not have any populations from the Mediterranean. The Mediterranean Sea has a unique environment, and it would be intriguing to know whether the classic Atlantic–Mediterranean break also exists in wahoo. Secondly, our study utilised a pooled sequencing approach to maximise the number of individuals and populations we could sample. But pooled sequencing precluded individual-based analyses that could provide insights into processes of dispersal and selection that might shape patterns of genetic differentiation among populations. Future works using individual genotypes would provide more power to unravel the demographic and evoltuionary processes opertating in this species.

If you could study any organism on Earth, what would it be?

[Isabel]: My main interest is in fisheries, and I can think of many fascinating marine animals. However, the most intriguing organisms are still humans. Specifically, I would like to study the mechanisms behind our decision-making process around natural resources exploitation and consumption. Our behaviour has such a significant impact on shaping life on Earth that unveiling those patterns could substantially affect how we address environmental challenges.

[Josh]: There are so many species that spring to mind! But I would love to study pikas, genus Ochotona. I fell in love with these cute little lagomorphs when I saw them featured on a David Attenborough documentary. They live in beautiful alpine talus and meadow habitats and are incredibly industrious; they make hay to survive through the winter!… adorable.

Are there general principles governing geographical range evolution?

A simple rule that unites geographical range evolution across terrestrial and marine environments.

Above: Holacanthus ciliaris (left) is broadly distributed, from the state of Florida (USA) to Santa Catarina (southern Brazil), whereas Hyplopectrus providencialis is endemic to the Caribbean islands of San Andrés and Providencia. Photographs by Osmar J. Luiz..

If one were to ask the above question to biogeographers, the answer would likely be no. Each species is unique, and geographical distributions seem idiosyncratic and perhaps too dependent on the arbitrary nature of geographical barriers. However, a recent study in our research group seemed to point in another direction: in the case of terrestrial vertebrates, their geographical limits closest to the poles evolved substantially faster than limits closest to the equator. Indeed, those differences were far from subtle, with high-latitude limits evolving 1.6–4 times faster than their low-latitude counterparts. Interestingly, the same pattern was shared across organisms with drastically different life-histories, from snakes to carnivores. In our featured paper on Journal of Biogeography, we set out to test whether this difference was also found in the marine realm. We analyzed a massive dataset including over five thousand reef fish species from around the world and repeated the analyses at varying phylogenetic levels (families vs. orders), as well as between different ocean basins. The vast majority of our analyses were consistent with the expected rate variation between high- and low-latitude limits for reef fish, whereas those that failed to do so might have been affected by the relatively small number of species in those particular taxa.

Editors’ Choice article: (Free to read online for a year.)
Pie, M.R., Divieso, R., Caron, F.S., Siqueira, A.C., Barneche, D.R. and Luiz, O.J. (2021), The evolution of latitudinal ranges in reef-associated fishes: Heritability, limits and inverse Rapoport’s rule. J Biogeogr. https://doi.org/10.1111/jbi.14150

What could be the mechanism underlying such differences in rates of evolution between high- and low-latitude limits? One possibility is that organismic, physiological processes could provide an intrinsic bias, such that adaptation to warmer conditions would be inherently more difficult to attain than adaptation to colder conditions. There is some evidence based on physiological and artificial selection studies of some taxa that indeed support this idea. However, if this is true, it would only push the question one step back: why would organisms show this asymmetry in their capacity to evolve different range limits in the first place? The short answer is that we don’t know, particularly because we just recognized that this phenomenon even existed. One possible mechanism involves the spatial differences in climatic conditions. Regions farther from the equator are not only colder, but almost invariably more seasonal. Therefore, on average, organisms of a given species that are nearest to the poles experience a broader range of environmental conditions than those nearest to the equator. As a consequence, low- and high-latitude range limits could correspond to cold- and hotspots of climatic adaptation. Alternatively, as the low-latitude tends to overlap with more species as a consequence of the latitudinal gradient in species diversity, the higher rate of evolution in the limit closest to the poles might be due to the relatively lower influence of interspecific competition in constraining their geographical distributions. Regardless of the mechanism, exploring further the drivers of variation in the rates of evolution of range limits might be a particularly exciting area for future research, particularly by exploring whether they are also found in other organisms, such as plants and invertebrates. In addition, the fact that such a universal pattern remained unnoticed for so long underscores how much we have yet to learn about the drivers of species distributions, particularly at long temporal scales.

Written by:
Marcio R. Pie
Associate professor, Department of Zoology, Universidade Federal do Paraná, Brazil

Additional information:
@marciopie, pie-lab.org

Acknowledgements:
I would like to thank Raquel Divieso (@raqueldivieso) and Fernanda Caron (@fercaron) for providing valuable feedback on this blog post.

ECR Feature: Ruan van Mazijk on floral species-area relationships and environmental heterogeneity

Ruan van Mazijk is a Masters student at the University of Cape Town. He is broadly interested in the ecology and evolution of plants. Ruan shares his recent work on how environmental heterogeneity influences species-area relationships in floral species from the Greater Cape Floristic Region and the Southwest Australia Floristic Region.

Ruan watching the sunset over the foothills of the Cape Fold Belt Mountains (namely in Bainskloof Pass), home to the Cape Floristic Region’s rich montane flora. Photo credit: Hannah Simon.

Personal links. Twitter | ResearchGate | Google Scholar | GitHub

Institute. University of Cape Town (Department of Biological Sciences)

Academic life stage. Masters

Major research themes. (Plant) phylogenetic systematics, macroecology, biogeography and trait ecology

Current study system. I currently work in the Cape Floristic Region (CFR) on the evolution and ecology of its plentiful plant species. My BSc Honours work formed the basis for my recent paper in JBI. My Masters dissertation explores how plant physiology and ecology vary with species’ genome-size in two species-rich clades of sedges, Schoenus and Tetraria. Both these genera have their centres of diversity in the CFR. Schoenus exhibits a broad range of fairly large, polyploid genomes. Tetraria, however, is much less variable, with most species having much smaller genomes than Schoenus. We know that genome-size affects organismal biology in a variety of ways. Most strikingly, plant stomatal dimensions are positively related to the amount of genetic material in cell nucleii. My work aims to demonstrate how other physiological functions of plants related to water- and gas-exchange (via stomata) might be affected by polyploidy-driven variation in genome-size!

Recent paper in JBI. Van Mazijk, R., Cramer, M.D. & Verboom, G.A. (2021). Environmental heterogeneity explains contrasting plant species richness between the South African Cape and southwestern Australia. Journal of Biogeography. DOI: 10.1111/jbi.14118. Wiley Content Link: https://onlinelibrary.wiley.com/share/author/Y2XIBHJBZPVMBXIIUWPA?target=10.1111/jbi.14118.

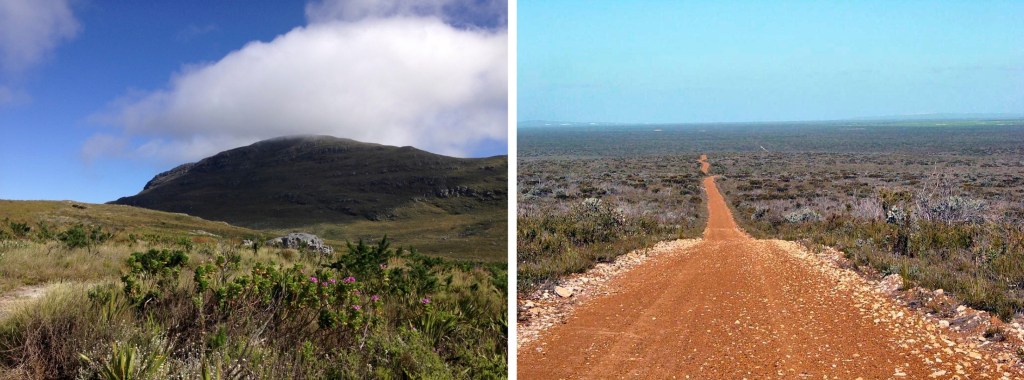
Motivation behind this paper. Our recent paper was based on my BSc Honours project, albeit very loosely, as the analyses are completely different in this paper. The topic my supervisors and I grappled with was the puzzling similarity in species richness of the Greater Cape Floristic Region (GCFR) and the Southwest Australia Floristic Region (SWAFR), two Mediterranean-type biodiversity hotspots with very different environmental conditions. Despite their climatic similarity the GCFR is rugged and mountainous while the SWAFR is flat, with only gentle hills. We know that complex and heterogeneous environments can support more species through greater niche diversity, and can facilitate speciation through adaptive radiations. Thus, the question follows: how can two plant biodiversity hotspots be so different in topography? What other forms of heterogeneity might be relevant (e.g., soil, rainfall)?

The differences in topography between the GCFR (left, mountainous) and SWAFR (right, flat as a pancake) are really striking! Pictured: Table Mountain National Park, South Africa (left) and Fitzgerald River National Park, Western Australia (CC BY-SA 3.0 Yewenyi).

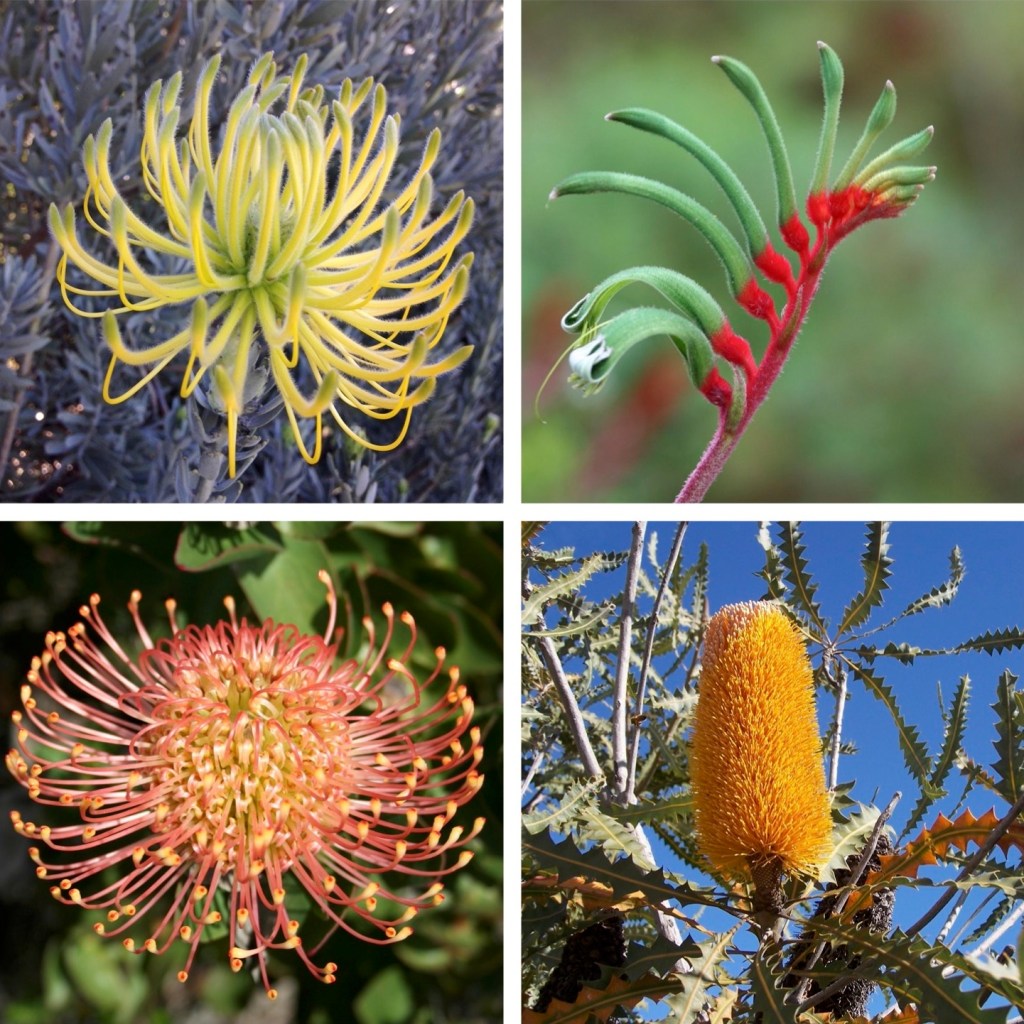
The plants of the GCFR (left) and SWAFR (right) have many of the same ecological adaptations and growth forms, nevermind the taxonomic affinities of both these regions’ floras. Pictured are four Proteaceae species (clockwise from top left): Leucospermum reflexum var. luteum, Anigozanthos manglesii (Red and green kangaroo paw) (CC BY 2.0 A. Chapman 2008), Banksia ahsbyi (CC BY 2.5 Gnangarra 2011) and Leucospermum cordifolium (CC BY-SA 3.0 Marco Schmidt 2008).

Methodologies. Using publicly accessible environmental and species occurrence data for both the GCFR and SWAFR, we compiled datasets of environmental heterogeneity that we could correlate to species richness. Not only did we explore the effects of heterogeneity in various environmental variables (e.g., elevation, rainfall, soil properties), but also a composite measure of environmental heterogeneity by summarising individual measures in a principal component analysis (PCA).

Challenges. This paper went through so many different drafts and different versions of the analyses that I’ve almost lost count. However, changes in approach to answering one’s original question can only delay things so much. Rather, these changes acted in concert with a combination of circumstances, external disruptions and the blows these dealt to my mental health. Circumstances included: carrying on with this while doing my MSc, the unfortunate inconvenience of loadshedding in South Africa, the advent of the coronavirus pandemic, and (chronic-, pandemic- and non-pandemic-related) illness in my family. I don’t want to make excuses, but this was a lot! On the upside, these challenges taught me a lot about myself and how to navigate some very difficult times.

Challenges. This paper went through so many different drafts and different versions of the analyses that I’ve almost lost count. However, changes in approach to answering one’s original question can only delay things so much. Rather, these changes acted in concert with a combination of circumstances, external disruptions and the blows these dealt to my mental health. Circumstances included: carrying on with this while doing my MSc, the unfortunate inconvenience of loadshedding in South Africa, the advent of the coronavirus pandemic, and (chronic-, pandemic- and non-pandemic-related) illness in my family. I don’t want to make excuses, but this was a lot! On the upside, these challenges taught me a lot about myself and how to navigate some very difficult times.

A selection of study species for my MSc (clockwise from top left): Schoenus compar, Schoenus albovaginatus, Tetraria ustulata, Tetraria thermalis. The tribe Schoeneae (Cyperaceae) is super morphologically variable, with T. thermalis reaching up to 2m (ca. 6ft 7in) tall and little S. albovaginatus getting down to 20cm (ca. 8in). These plants might be plain-looking at first, but their intricate inflorescence morphology and impressive contribution to a given fynbos landscape’s biomass make them hard to ignore!

Major results. We found evidence for a common positive relationship between floristic richness and environmental heterogeneity across the GCFR and the SWAFR, although the GCFR was more environmentally heterogeneous and species-rich. There are, of course, some region-specific effects. And those are also slightly dependent on spatial scale, although almost always positive effects across scales. We can conclude that the greater richness per unit area of the GCFR compared to the SWAFR is explainable in terms of the GCFR’s greater environmental heterogeneity. This helps support the idea that environmental heterogeneity is important in driving plant biodiversity. However, more work is required to understand how the effects of environmental heterogeneity change at different spatial scales, and it would be great to replicate this study in other geographic regions.

Next steps. Quite intuitively, the next step would be to apply a similar analysis across all five Mediterranean-type ecosystems (the GCFR, SWAFR, Mediterranean Basin, California and central Chile), to see whether the richness-heterogeneity relationship is applicable to them all, and to determine what forms of environmental heterogeneity vary between these floristic regions.

Additionally, in the context of the broader question, “How important is environmental heterogeneity (and which kinds) across Mediterranean-type ecosystems?”, it makes sense to expand the analysis to include absolute environmental variables. This will allow us to account for the importance of heterogeneity-type variables relative to absolute environmental variables. Though, this starts to get more complicated, and changes what the models are asking from, “Does heterogeneity matter in X regions?” to “Which matters more: heterogeneity or absolute conditions?” or “Let’s predict species richness as best we can”. With the latter, it starts becoming important to incorporate spatial structure and spatial autocorrelation into the models. This is easier said than done, and even easier done than to interpret the results!

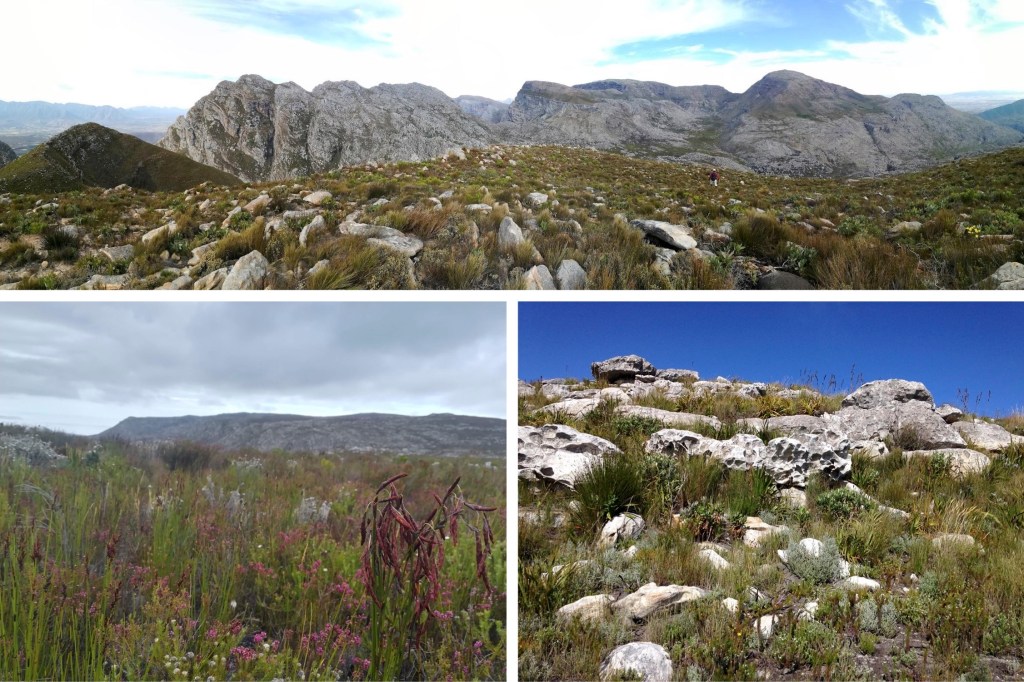
This is what makes me oh-so-happy to work in the fynbos around Cape Town. Clockwise from the top are the views from atop Observation Peak, in the crevices of the Silvermine region of Table Mountain National Park, and on the slopes of the Kogelberg.

If you could study any organism on Earth, what would it be? Plants, both great and small, are definitely my jam, having grown up in the fynbos of the southwestern Cape. But I’ve also got big soft spots for lichens, insects, birds, cnidarians, cetaceans and seals! If I’m studying something I find personally interesting and/or “beautiful”, then I’m happy.

Anything else to add? Within my lab, this paper took infamously long for me to get published, not least because of the reasons I described above. I know that isn’t particularly unique or exciting as an answer to an interview question, but I think it’s relatable for many. After many, very different drafts of this paper, I feel like (but am obviously not) a veteran of the scientific process. I guess I just want to send my thoughts and well-wishes out to anyone else trapped in “Manuscript Rewriting Hell”, and say this: you can look forward to an indescribable feeling of relief when it’s done!

ECr Feature: Leo Ohyama on species-area diversity relationships in ants

Leo Ohyama is currently working toward his PhD at the University of Florida. He is an ecologist broadly interested in processes that shape the distribution of biodiversity. Leo shares his recent work on how species divesity scales across space in ant species across the globe.

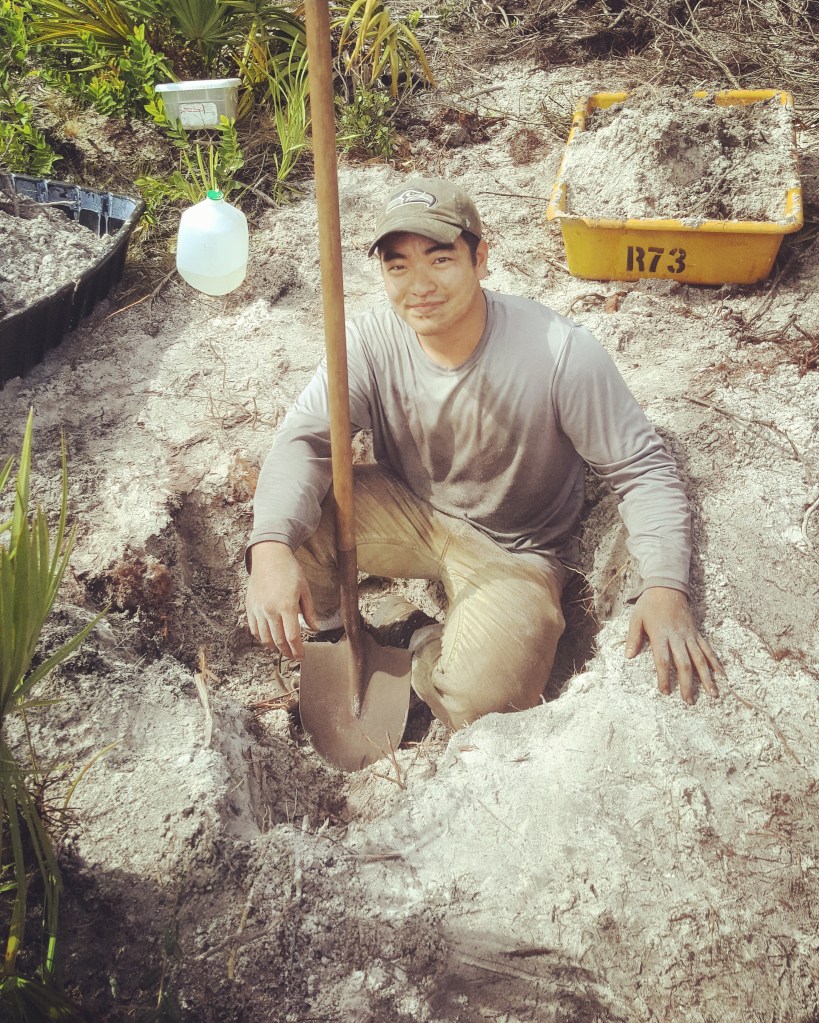
Leo digging for ants in the flatwoods of Florida, USA before his interest in programming got him into an air conditioned room.

Personal links. Twitter | ResearchGate

Institute. University of Florida, Biodiversity Institute

Academic life stage. PhD

Major research themes. Broadly I am interested in how and why global biodiversity patterns are assembled and whether we can apply predictive frameworks to better understand the future of the biosphere. I am also interested in scaling up natural history to global scales through the collection and curation of traits-based data in ants (sociometric data). My themes of research lie along macroecology, island biogeography, and community ecology.

Current study system. Ants! Ants are one of the most widespread and globally distributed groups of invertebrates on the planet and make up anywhere from 15 to 20% of terrestrial biomass. They are also one of the most well-sampled invertebrates in island systems and have thrived and found success in colonizing islands around the world. Given their success they are a key insect group to include in studies that attempt to understand the spatial scaling of biodiversity.

Recent paper in JBI. Ohyama L, Holt RD, Matthews TJ, Lucky A. The species-area relationship in ant ecology. Journal of Biogeography. 2021;00:1-18 https://onlinelibrary.wiley.com/share/YH8KA4IE8XF5NXMMNHVU?target=10.1111/jbi.14149

Motivation behind this paper. The motivation was really two-fold. The first one being that while patterns of ant diversity have been well documented across the planet, no one has really looked at the scaling properties of all these studies at a global scale. To me, understanding these scaling properties are just as important as understanding the general patterns of diversity as they can link local-scale processes to global-scale processes. Islands in both mainland and insular areas are an excellent system to leverage to understand these scaling properties given that ants have been well sampled across many islands around the globe.

The second motivation was that this paper was conceptualized during the beginning of the pandemic when my fieldwork was cancelled. Without any fieldwork and extra time, working on a more computational, data-synthesis project was ideal as I could work on it remotely, although it involved many weeks of reading and reviewing the literature. This was happening before finalizing and proposing my dissertation research topic. Being able to survey the literature, run analyses, and write up this paper really helped me flesh out my plans for what I wanted to do with the rest of my dissertation.   

Heavily armored ‘tank ants’ (Nomamyrmex esenbeckii) are a species of army ants that roam the forest floors of Ecuador and were recorded in several mainland fragments from the studies leveraged for the paper. They are top-predators in tropical rainforests, and specialize in raiding the nests of leaf-cutter ants. Their long raiding parties are often protected by fierce guards, fending off anything that comes too close. Picture by Philipp Hönle

Key methodologies. A novel methodology that we utilized in this study was the application of piecewise models to identify specific breakpoints which estimate the spatial scales where the slope of species-area relationships significantly shifted. These models were made available from a new function in the ‘sars’ package (Matthews & Rigal, 2021), of which one of my co-authors, Tom Matthews, was a developer. These breakpoints can be compared between different systems, such as mainland and insular systems, which helps us better see how species-area relationships change at different spatial scales among different systems.

Unexpected results and challenges. We surprisingly found that the rate at which species richness increases across area was higher in mainland relative to insular systems. This is opposite to what is often observed in the literature across a variety of taxa. Additionally, we found that precipitation was a key driver in the scaling of ant biodiversity, which contrasted other works that suggested precipitation was less influential on ant biodiversity. In terms of challenges, this was my first time writing a paper where all the co-authors were only reachable over zoom and email. In fact, two of the authors were in different countries and time zones. However, my co-authors were amazingly supportive, and I was able to proactively seek out zoom meetings with other colleagues to discuss the paper and get insight when needed.

Major results. The major result of this paper is a more comprehensive understanding of how different factors affect spatial scaling in ant biodiversity. We not only find that ant biodiversity scales at higher rates across mainland areas relative to insular ones, but we also find strong differences in these scaling properties across different biogeographical realms while also being heavily influenced by precipitation. Although ant diversity patterns are well studied across the world, the scaling properties of this diversity are less well understood, so our analyses provide much needed insight into these lesser-known areas. Additionally, our thorough review of the many studies allowed us to identify key areas for further research, including the assessment of island age and the interactions between non-native and native ants in insular systems. Finally, we accumulated a decent-sized dataset of ant diversity across a variety of islands and archipelagos around the world that can be used by other scientists to conduct their own studies on spatial scaling.

Next steps. One of my more exciting ideas is actually written in the paper! We discuss how the age of mainland islands (oftentimes habitat fragments) influence the species-area relationship. As such we propose a continental analog to the general dynamic model of island equilibrium. The inclusion of a temporal dimension to the species-area relationship has been explored but the comparison of this between insular systems and mainland systems is less well understood. This idea excites me as it involves two important dimensions, space and time, which are both crucial to the scaling of biodiversity. Temporal scale data is often rare but for ants this is not always the case.

If you could study any organism on Earth, what would it be? That’s a tough question! My initial answer would be ants because I’ve worked with them for a while now and have developed a particular fondness for them. But if I had the opportunity, I would like to study freshwater fish. This is mostly driven by the completely different system that these organisms live in. For example, in river systems, you have water currents and a network of streams and water sheds to consider when thinking about dispersal or other assembly mechanisms in a community. As a person who has mostly stuck to working with ants, these new challenges are mind-bending but also excite me because they prompt new ways of thinking. I guess I am usually more drawn to the questions and would love to keep challenging myself with different organisms, but ants will always be a staple for me (there’s plenty of them around!).

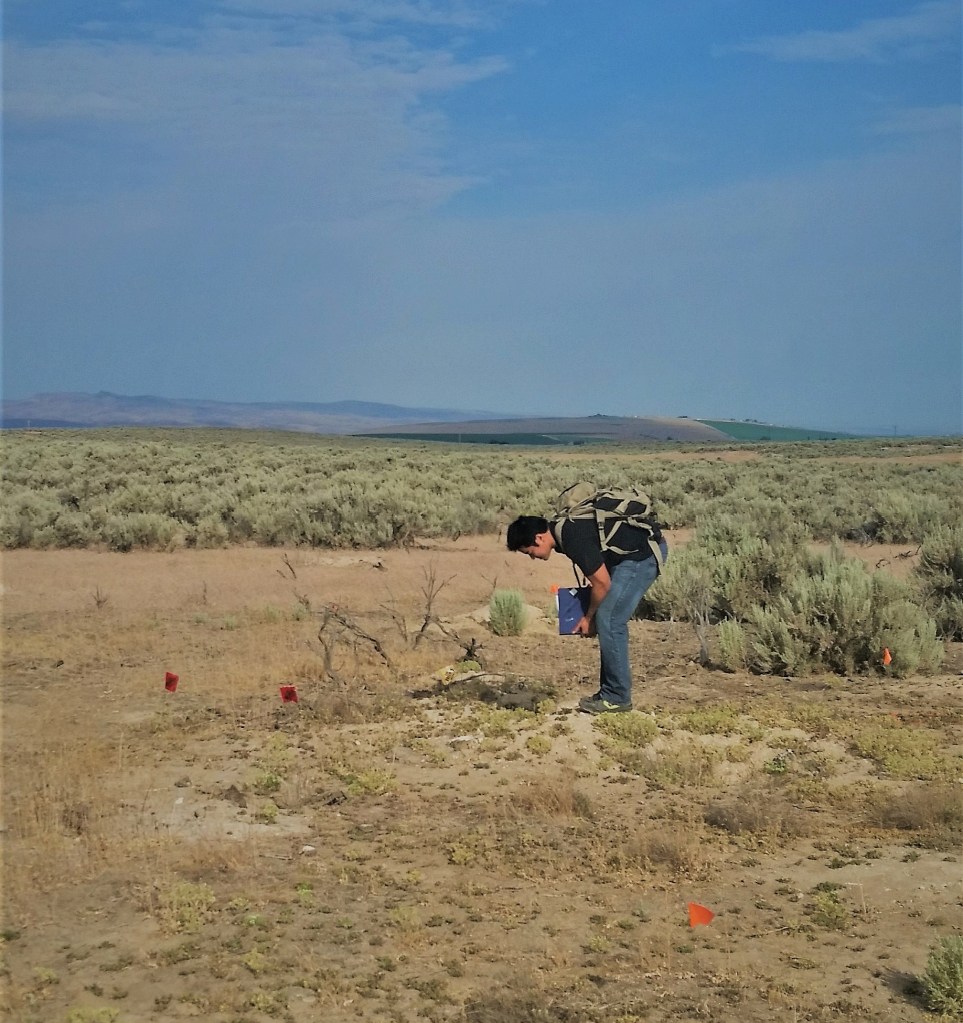
Leo observing harvester ants in the sagebrush landscape of Idaho, USA.

Anything else to add? Two things! First, my inspiration to tackle scaling topics originates from a biogeography class I took when I was a master’s student. One day in this class we spent two hours debating the concept of scale and never came to a conclusion other than “it all depends on scale”. This was a powerful moment for me and really inspired me to keep thinking about scale and the synthesis between different scales which has ultimately led to this paper. The other thing I would like to add is that I was privileged to spend an extensive amount of time doing fieldwork and studying the natural history of ants at the local community scale during my master’s degree. While I enjoy programming and working on the computer, I believe that having a grounded understanding of the study organism, including its natural history is important. It’s also important to tie the inference we make at global scales to these local scale mechanisms or local-scale studies.