From curiosity to community assembly: how a birder’s frustration opened the door to a new journey of discovery about taxonomic, functional, and phylogenetic diversity of ants on islands.
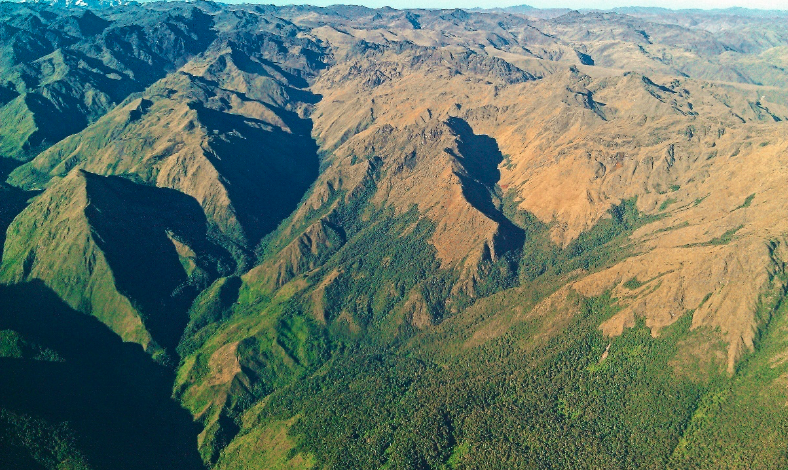
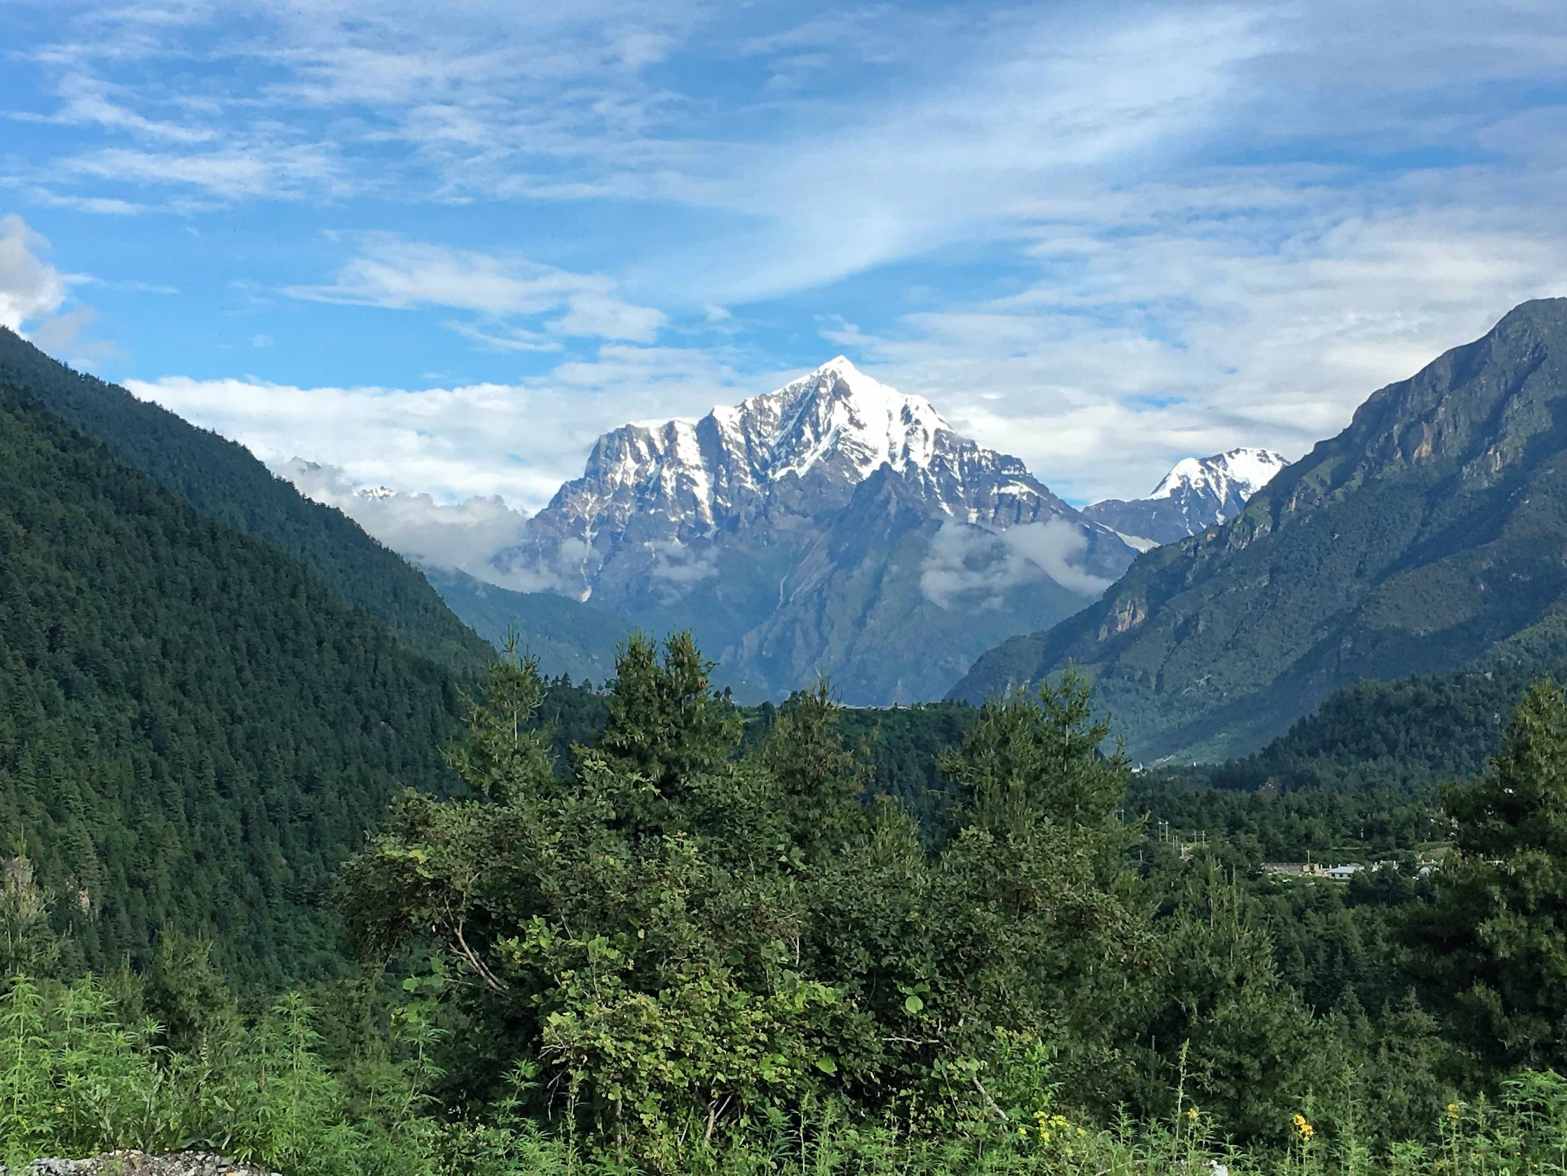
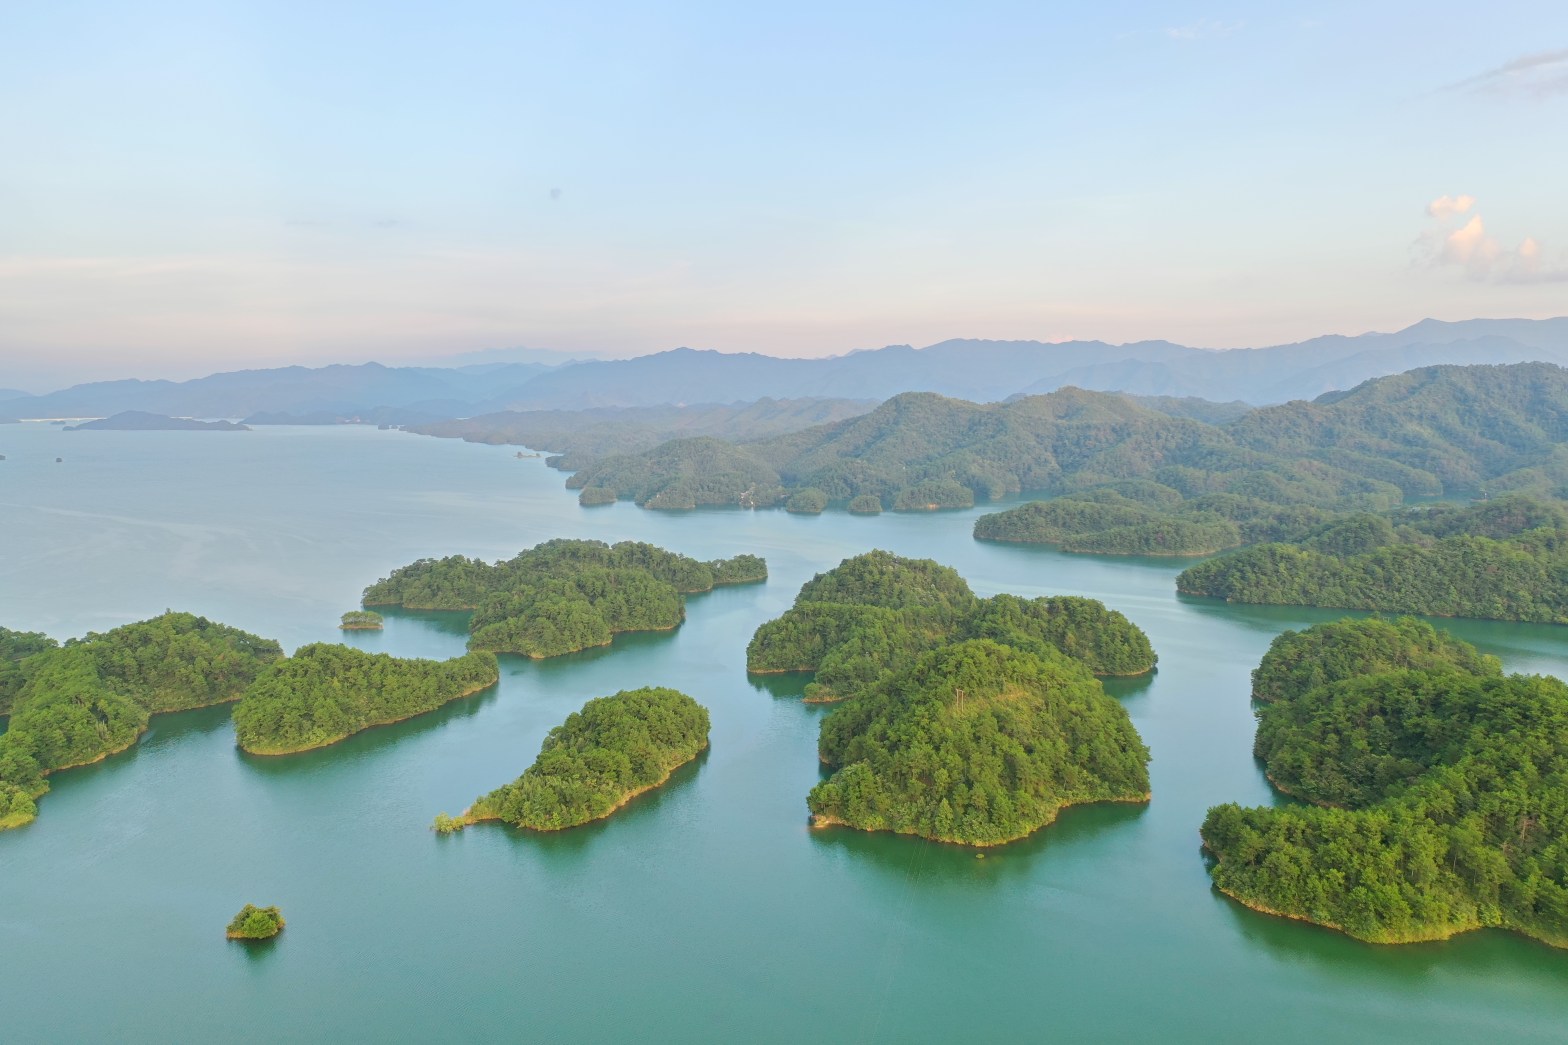
When I started my Ph.D. career and went to the Thousand Island Lake (TIL) to do fieldwork for the first time in 2014, I was attracted to the natural landscape immediately. Before then, I had never been to any reservoir islands. TIL was formed by dam construction in 1959, and is one of the largest human-made reservoirs in China. The lake area is approximately 580 km2 and includes more than 1,000 islands (as its name suggests). Each island was previously a hilltop before flooding.
Above. Thousand Island Lake. Photo credit: Wande Li.
EDITORS’ CHOICE (Read for free until Aug 2022): Zhao, Y, Dunn, RR, Zhou, H, Si, X, Ding, P. Island area, not isolation, drives taxonomic, phylogenetic and functional diversity of ants on land‐bridge islands. J Biogeogr. 2020; 00: 1– 11. https://doi.org/10.1111/jbi.13860
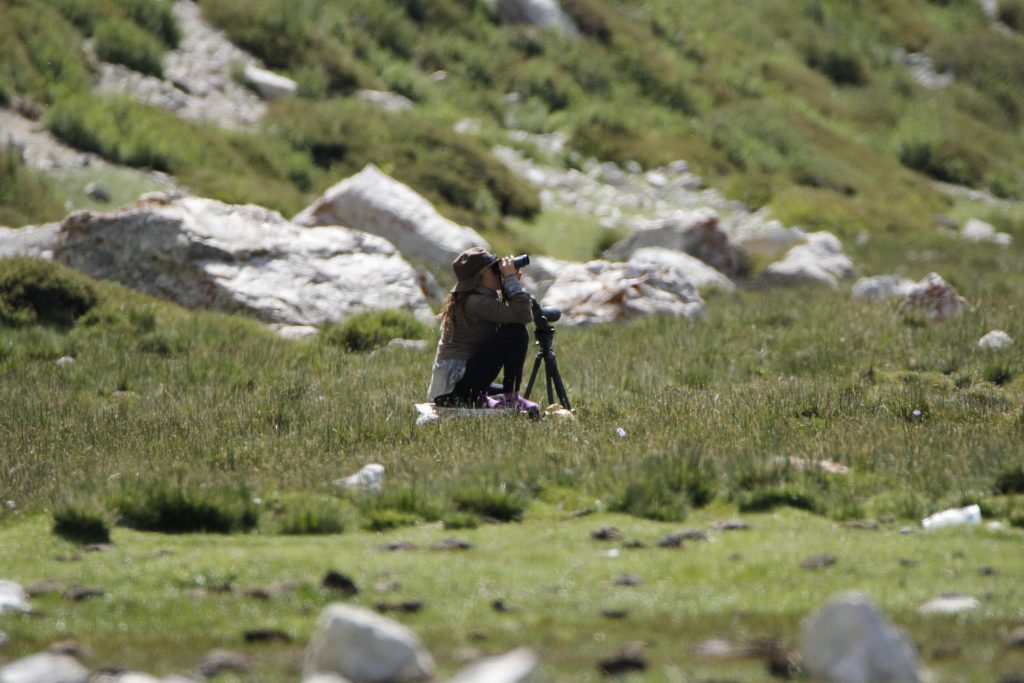
Since 2003, a research group led by Prof. Ping Ding at Zhejiang University has been conducting bird surveys in TIL. I was trained as a “birder” too. However, I was surveying birds on a tiny island one day, and was frustrated that there seemed to be no birds to watch on that island. As I walked around searching for birds, I noticed that the island was covered by a massive number of black ants (years later I would realize that this black ant was Brachyponera chinensis, known as Asian needle ants), these ants walked all around me, and I stared at them for a long time just like a little child will do. That was the very moment I wondered how many and which ants can be found on each land-bridge island, and why.
I returned home and began to search for articles about ants. The more I learned, the more I was attracted by these little creatures. I realized that many ecologists around the world had used ants as the target taxon. Among them, Edward O. Wilson, who was inspired by his travels and ant collecting in the South Pacific, together with Robert H. MacArthur to develop one of the most iconic theories in ecology: the Theory of Island Biogeography (TIB). TIB predicts that larger and less isolated islands should host a larger number of species than smaller and more isolated islands. However, the classic TIB model does not consider the evolutionary and functional differences among species (i.e., phylogenetic diversity and functional diversity). I began to think that there was a project in the making with ants, maybe even a Ph.D. I could, I began to think, study not only the number of kinds of ants on the different islands, but also their evolutionary and functional diversity.
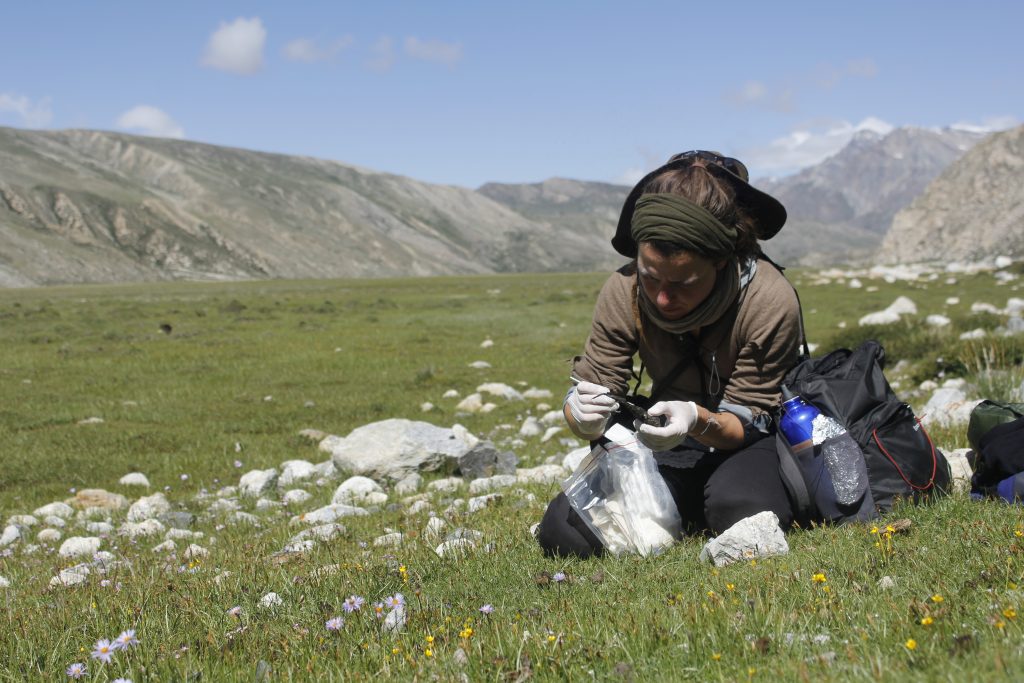
In 2017, after a discussion with my supervisor Prof. Ping Ding, along with other co-authors, we decided to survey ants on different islands in TIL using different capture methods. Meanwhile, we also planned to sequence the DNA and measure the functional traits of all ant species to infer the phylogenetic and functional diversity of ants.
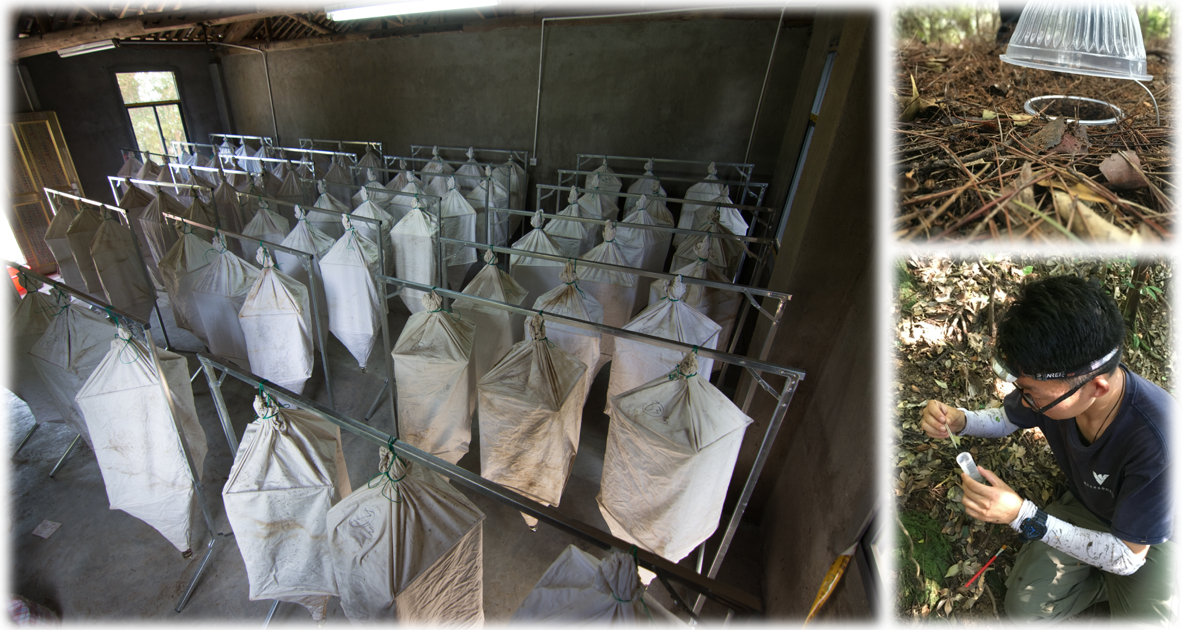
Different capture methods: Winkler extraction (left), pitfall traps (upper right), and hand collection (lower right). Photo credit: Yuhao Zhao.
After two years of sampling, we captured over 90,000 individual ants across 33 islands, belonging to 97 species in 44 genera and eight subfamilies. The counting process was daunting as sometimes a trap can collect thousands of ant individuals, and we need to count them one by one. However, the results were promising. We found larger islands possessed more species and higher phylogenetic and functional diversity than smaller islands, which is consistent with the prediction from the classic theory of island biogeography. However, isolation did not significantly influence the taxonomic, phylogenetic, and functional diversity of ants.
To move a further step, we wanted to know if the underlying processes of community assembly on different islands are the same or not? Based on previous research of bird studies in the same system (Si et al. 2017, link: https://doi.org/10.1111/1365-2656.12650), we hypothesized that communities on smaller and more remote islands might be highly clustered (with more closely related ant species than expected by chance) because the subset of species either shares similar functional traits or similar evolutionary histories. Conversely, communities on larger and less isolated islands may be overdispersed (with fewer closely related ants than expected by chance) because these islands provide more potential habitats and niches, and closely related species would compete for resources, resulting in close relatives being competitively excluded from the community. Using a null modelling approach, we found that the structure of ant communities shifted from phylogenetic and functional clustering on smaller islands to phylogenetic and functional overdispersion on larger islands. That is to say, environmental filtering is the dominant process structuring ant communities on smaller islands, and that competitive exclusion becomes more important on larger islands.
More interestingly, we also found incongruencies between phylogenetic and functional dispersion patterns. Overall, phylogenetic structure of ant communities tended to be clustered, whereas functional structure of ant communities tended to be overdispersed. These results suggest that distinct mechanisms may influence phylogenetic and functional structure of ant communities, i.e., environmental filtering influences phylogenetic community structure of ants, whereas competitive exclusion influences functional community structure of ants. Our findings, again, highlight the need to examine both phylogenetic and functional diversity to understand the mechanisms that govern the assembly of natural communities on islands.
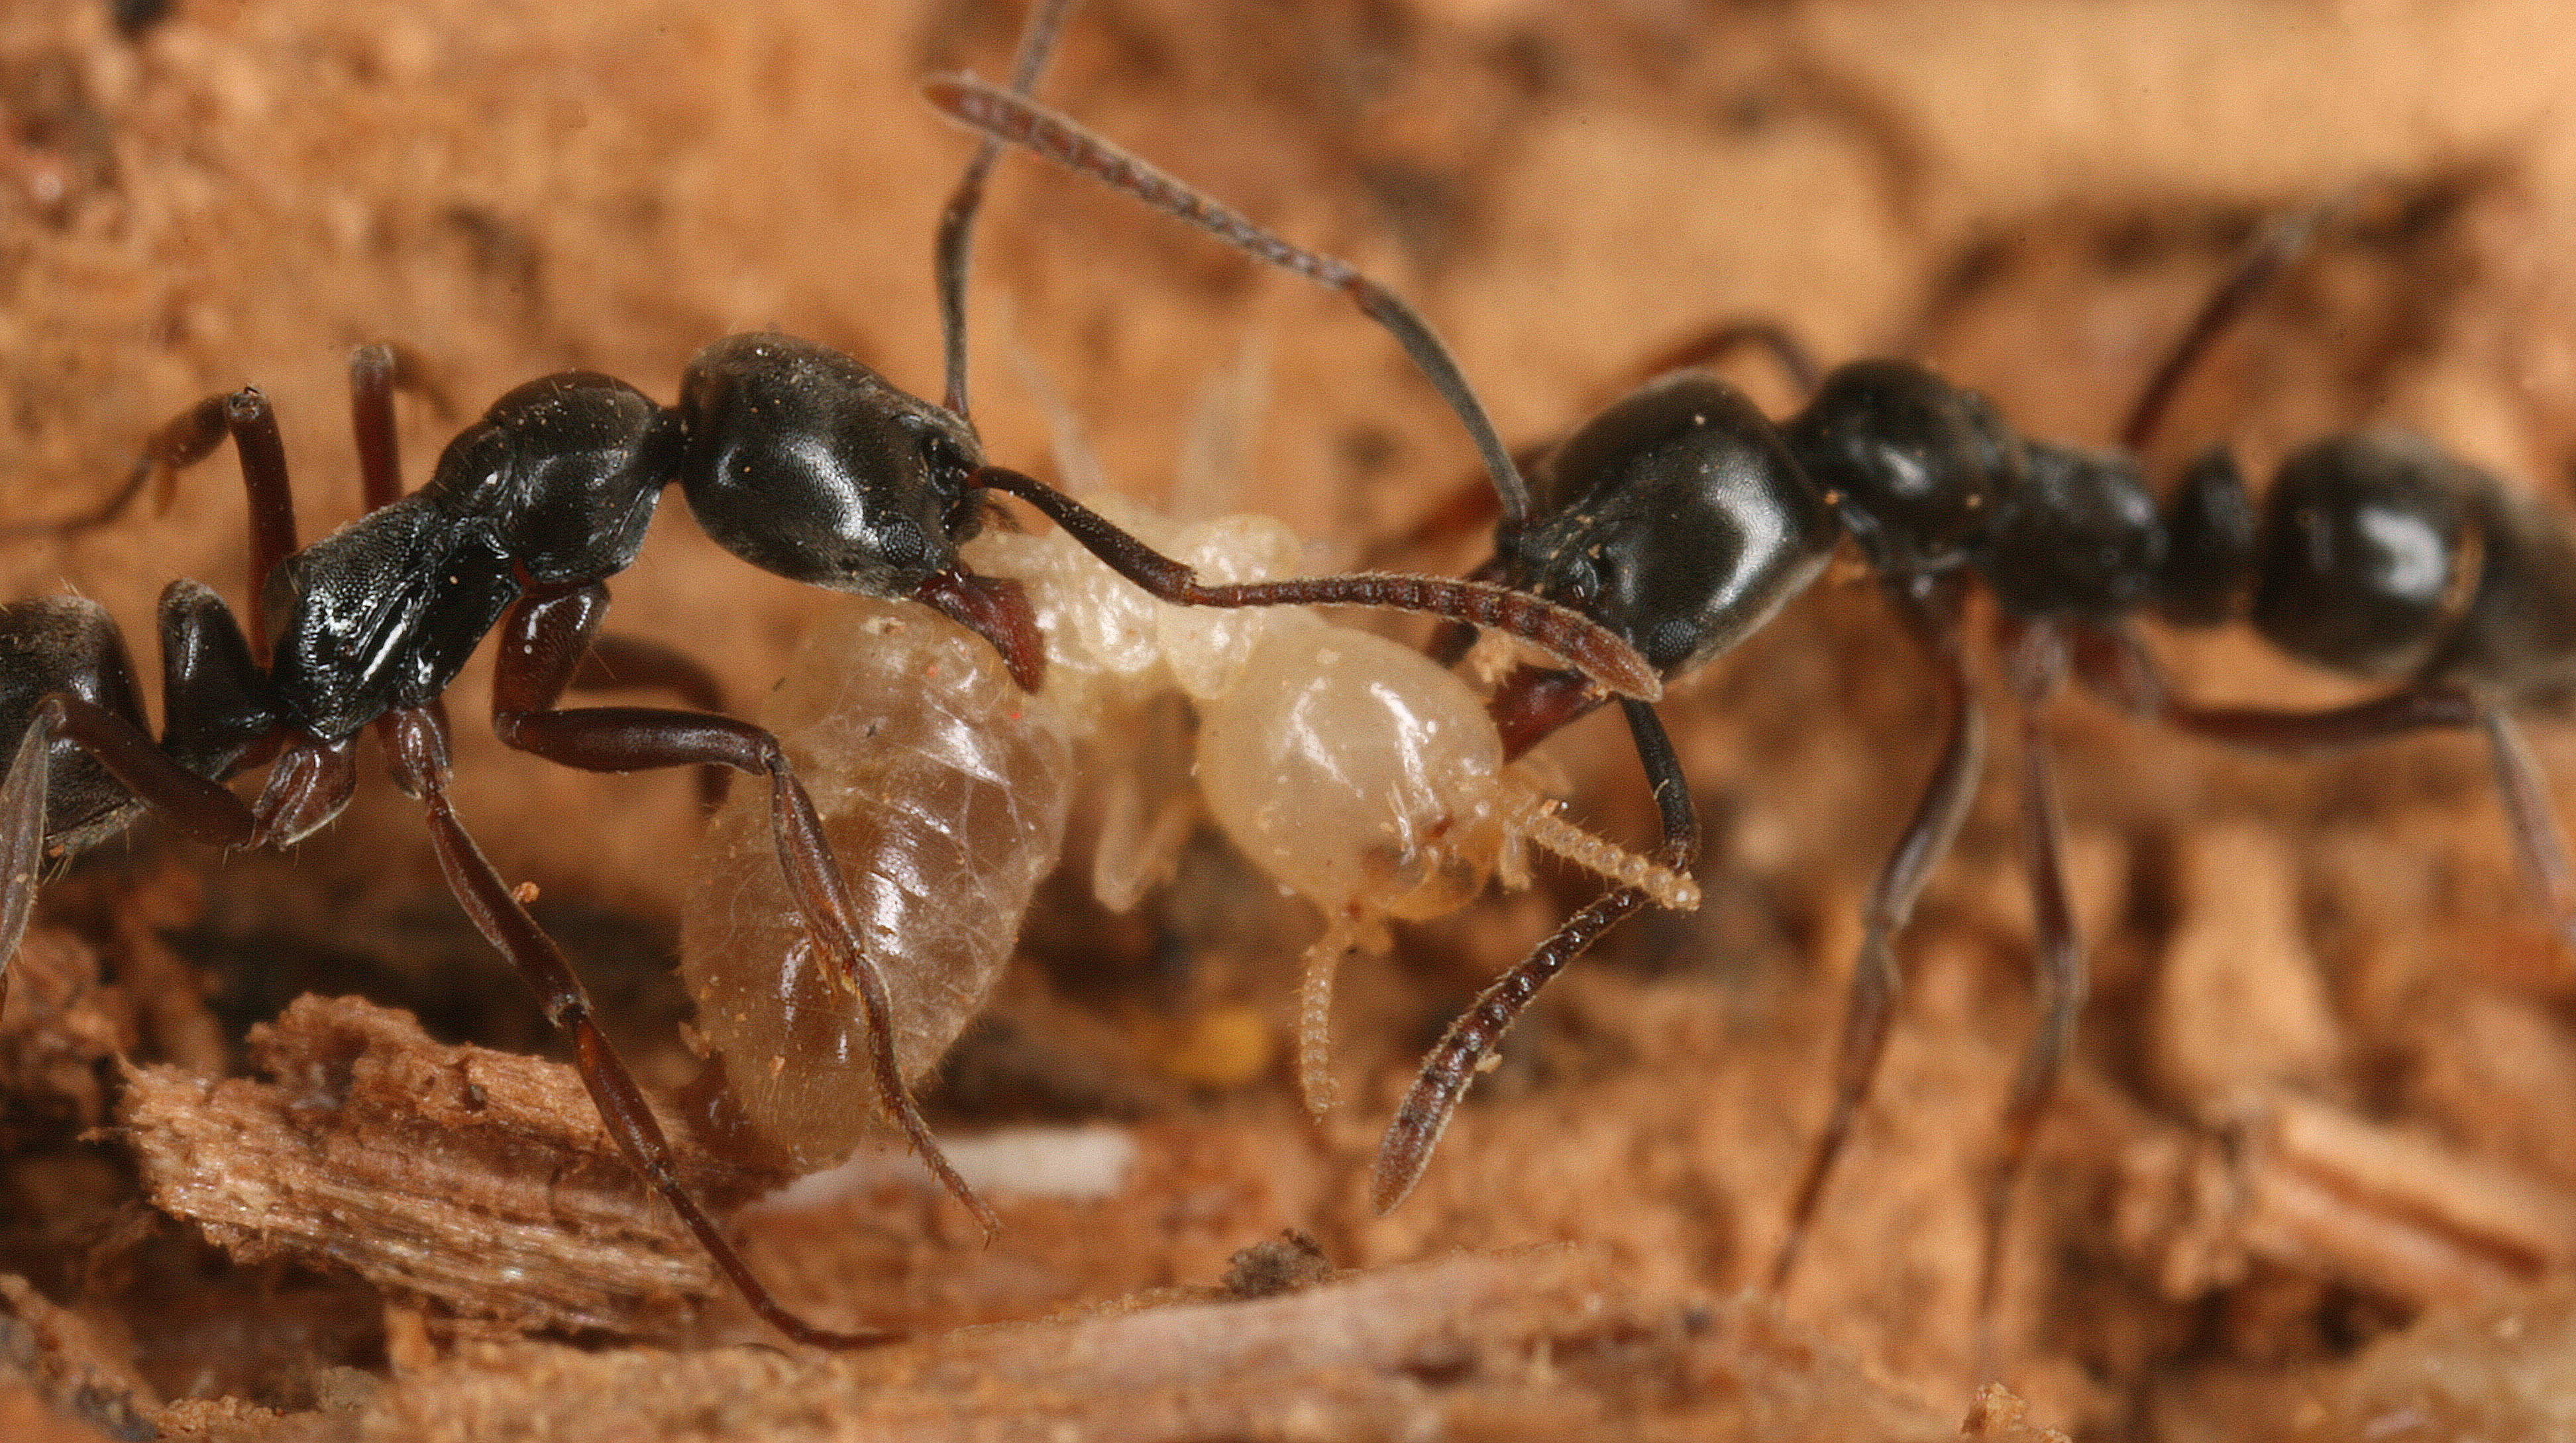
The Asian needle ants (Brachyponera chinensis) attacking a termite. Photo credit:Benoit Guénard.
During our ant sampling in the field, we inevitably noticed the interaction between ants and termites, as well as ants and aphids, and ants and plants. Although these interactions have been well documented, few works have investigated the variations of these interactions among islands. Based on our knowledge of ants in the TIL region, we now have multiple projects to understand the influence of ant on other species, and the functional roles of ants in the land-bridge island ecosystem.
Written by:
Yuhao Zhao – Postdoctoral fellow, School of Ecological and Environmental Sciences, East China Normal University.
Additional information:
https://faculty.ecnu.edu.cn/_s31/sxf2_en/main.psp ; http://robdunnlab.com/ ; http://antmaps.org/
I would like to thank Xingfeng Si and Rob Dunn, who provided feedback on this blog post, and Wande Li and Benoit Guénard to provide the photos.