Carlos is a PhD student at the University of Girona in Spain. He is an environmental engineer with special focus on freshwater ecology. Here, Carlos shares his recent work on the ecology and distribution of Iberian fishes.
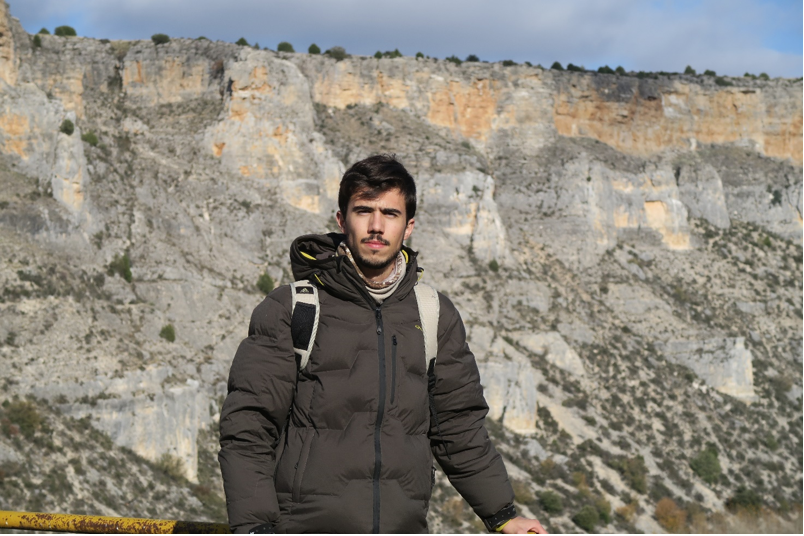
Carlos Cano-Barbacil in the canyon formed by the Riaza River (Segovia, Spain)
Personal links. Personal website | Twitter | Instagram | Google Scholar | Researchgate
Institute. GRECO, Institute of Aquatic Ecology, University of Girona (Spain)
Academic life stage. PhD student
Major research themes. My research is mainly focused on studying the multifaceted relationships between inland fish distribution patterns, species traits and their evolutionary history, in order to advance our understanding of species’ responses to environmental change and biological invasions.
Current study system. Our study area comprises the Iberian Peninsula, in southwestern Europe, whose rivers are highly hydrologically altered and fragmented due to the presence of over 1,500 large dams. Compared with other regions, Iberian freshwaters are poor in terms of species richness, yet a large part of their freshwater fauna is endemic and threatened (68 native fish species, of which 41 are endemic), in part due to a high proportion of exotic species (32 species). Thus, almost 45% of the native species exhibit declining population trends. For instance, diadromous fish populations have decreased by about 90% since the 1950s, according to recent studies.
Recent JBI paper. Cano-Barbacil, C.; Radinger, J.; & García-Berthou, E. 2022. The importance of seawater tolerance and native status in mediating the distribution of inland fishes. Journal of Biogeography. https://doi.org/10.1111/jbi.14493
Motivation behind this paper. Understanding the ecological and historical factors that explain species distributions is a main focus in biogeography and ecology. However, the effect of seawater tolerance on contemporary inland fish distributions, and how this is mediated by the status of being native vs. alien to a given region, has been barely investigated. Thus, the main motivation of our study is to understand the role of different climatic, topographic and anthropogenic variables in explaining the distribution of Iberian inland fishes, considering native and alien species, and how these variables relate to seawater tolerance and other fish traits.
Key methodologies. We analysed the distributions of the 68 most common inland fish species across the Iberian Peninsula using species distribution models (SDMs). We then compared the importance of different environmental predictors among the three Darlington’s divisions (primary, i.e. strict freshwater; secondary, i.e. salt-tolerant; and peripheral, i.e. diadromous and marine origin), as indicators of seawater tolerance, and between native and alien species, using a multivariate permutational analysis of variance (PERMANOVA). Finally, in order to explore the importance of specific environmental predictors in determining the distribution of different fish traits, variable importance obtained from species distribution models were subjected to a redundancy analysis (RDA).

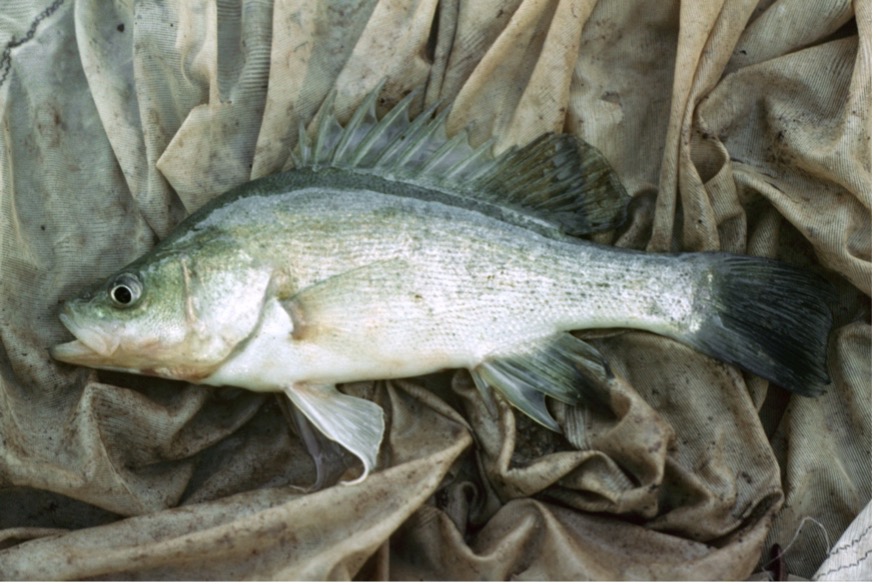
The Aldeadávila’s dam in the Douro River (Salamanca, Spain) has a height of 139.5 m, and is one of the most important hydroelectric plants in Spain. Invasive alien species such as the zander (Sander lucioperca) and the black-bass (Micropterus salmoides) have become abundant in the reservoir.
Unexpected challenges. One of the greatest challenges of our research was finding halotolerance experimental quantitative data for inland fish species. In fact, data was only available for 19 out of the 100 species present in the Iberian Peninsula, of which 14 were alien species and 5 were native, but none were Iberian endemics. Thus, we decided to use Darlington’s classification as an indicator of seawater tolerance. Our results showed that Darlington’s divisions are significantly correlated to halotolerance. Moreover, Darlington’s divisions are a very well-established, fully available and standard classification that reflects not only the seawater tolerance of fish, but also their eco-evolutionary history. Similarly, other authors have previously considered this to be a leading classification system of inland fish when evaluating their distribution patterns.
Major results. We found that seawater tolerance is a key feature for understanding the current distribution of inland fishes. Moreover, the importance of explanatory variables changes between native and alien species, and especially among Darlington’s divisions. For instance, the river basin was more important for primary species, suggesting that these fishes are confined to their specific and potentially isolated drainage systems, or that their distribution is conditioned by their history of invasion in the case of alien species. However, the distribution patterns of secondary fishes resemble those of peripheral species. Accordingly, we can find these species in the mouths and lower reaches of rivers or in coastal lagoons, some of which are hypersaline and reach very high temperatures, especially during the summer months. We also found that increasing temperature and damming were positively associated with the presence of tolerant, large-bodied and warm-water invasive alien species from more hydrologically stable habitats.
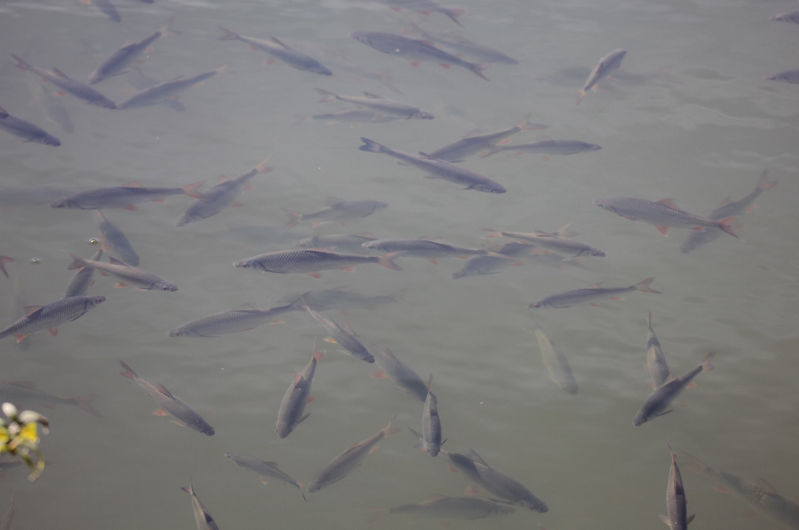
A school of invasive common roachs (Rutilus rutilus) and one endemic Catalan chub (Squalius laietanus) in the Ter River (Girona, Spain).
Next steps for this research. We are interested in investigating differences in niche properties (niche breadth and niche position) between native and alien Iberian inland fish species. Specifically, we want to evaluate the relationship between the time of introduction of alien species and their niche characteristics, in order to better understand the invasion process. We also want to explore differences in distribution patterns and life history traits among primary, secondary and peripheral fishes at a broader scale.
If you could study any organism on Earth, what would it be? I would like to study freshwater mega-fishes, as their global populations have drastically decreased by 94% in the last 50 years due to river fragmentation, the introduction of non-native species, pollution, water abstraction, climate change and habitat transformation.
 .
.