Rodolfo Anderson has just finished his PhD at the Monash University in Australia. He is an ecophysiologist interested in understanding the factors underlying the distribution of ectotherms. Here, Rodolfo shares his recent work on geographical correlates of the vulnerability of lizards to climate change.

Rodolfo at the Itatiaia National Park, Minas Gerais, Brazil.
Personal links. Twitter
Institute. School of Biological Sciences, Monash University, Australia
Academic life stage. PhD (just finished)
Major research themes. Ecophysiology; herpetology; biogeography
Current study system. Lizards! I have been studying these amazing animals since I graduated from the University of Michigan. First of all, they are super cool; because of their appearance, reptiles, in general, have a fascinating morphology. Second, lizards are dependent on environmental temperatures to regulate their own body temperatures, affecting virtually all aspects of their physiology. Lizards are an excellent model for investigating the underlying mechanisms shaping their distribution, as they have strict physiological associations with physical aspects of their environment. In other words, the way they survive in contrasting environments makes them a very interesting model for biogeographical research.

Lizards are threatened by climate change due to risk of rising global temperatures exceeding their upper thermal limits. The photo shows a Sand Monitor (Varanus gouldii) at Mutawintji National Park, New South Wales, Australia (Credit: Jules Faquhar).
Recent JBI paper. Anderson, R. O., Meiri, S., & Chapple, D. G. (2022). The biogeography of warming tolerance in lizards. Journal of Biogeography, 49(7), 1274-1285 https://doi.org/10.1111/jbi.14380
Motivation behind this paper. Lizards are ectotherms and, as such, are particularly impacted by climate change because hot temperatures can exceed their upper thermal limits, decreasing survival and leading to population collapses. Understanding where lizards will be most impacted by climate change is therefore imperative. However, previous approaches that investigated geographical trends in lizard vulnerability to climate change have relied on coarse-resolution environmental data (e.g., data from weather stations), which does not represent very well the actual body temperatures of the lizards. These animals can behaviourally thermoregulate and avoid heat stress. Besides, they have plenty of microhabitats to find shelter and cool off. In our paper, we incorporated these local processes (e.g., behaviour and microclimates) into global analyses of lizards’ vulnerability to climate change, hence producing more nuanced predictions about their vulnerability to climate change.
Key methodologies. We built a database including information on species’ thermal physiology, behaviour, and life-history traits (activity time, substrate affinity) to parametrise biophysical models to simulate body temperatures. Such models can predict the body temperature of lizards at high temporal and spatial resolution, being more accurate than traditional methods that account only for coarse environmental temperatures. From the simulated body temperatures, we then calculated two key vulnerability metrics to climate change: warming tolerance and hours of activity. The former tells us the difference between body temperatures and the critical thermal maximum of ectotherms; the latter indicates the length of activity, which is related with foraging and reproductive success. Finally, we sought out geographical trends (latitude, altitude, and biomes) in warming tolerance and hours of activity.

Incorporating microclimatic aspects and behaviour of lizards is key for accurately predicting their vulnerability to climate change, as these animals can avoid heat stress by selecting cool microclimates.
Unexpected challenges. We found divergent results when comparing the vulnerability metrics (warming tolerance and hours of activity) estimated from modelled body temperatures vs. macro climatic data. While warming tolerance estimated from modelled body temperatures exhibited no latitudinal trends and a weak relationship with altitude, warming tolerance estimated from macroclimate showed strong positive associations with latitude and altitude. Overall, warming tolerance was generally higher when calculated from macroclimatic data than body temperatures. These results reveal that vulnerability assessments derived from coarse climatic data can produce misleading predictions regarding lizard exposure (and ectotherms in general) to heat stresses.
Major results. By integrating ecological, behavioural, and physiological information into biophysical models, we could identify more nuanced geographical trends in the vulnerability of lizards to climate change. We found no latitudinal trends, which contradicts previous results showing that low latitude lizards are more threatened by rising temperatures than high latitude ones. Moreover, we also observed that high latitude species have less time for activity, but in future climatic scenarios they could have increased activity due to rising temperatures. Not least, we also identified that desert species and tropical forest species have a narrower warming tolerance than species from other biomes.

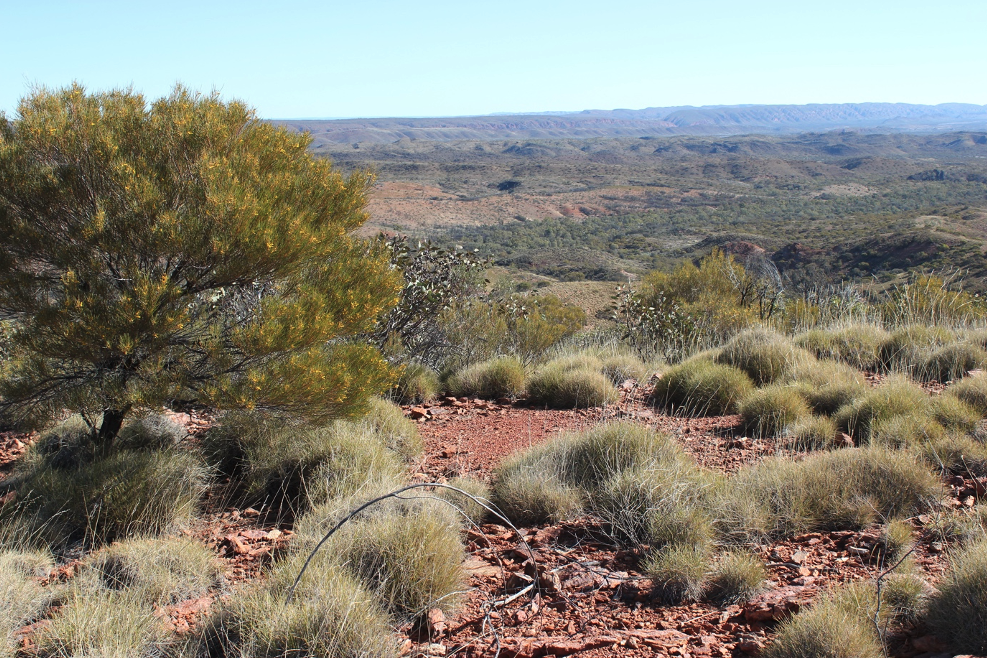
Species from deserts are predicted to be highly vulnerable to climate change. Photo of the Outback, Australia.
Next steps for this research. One is to examine whether warming tolerance and hours of activity will change in future climatic scenarios. Including other taxonomic groups would also be great to expand our range of inferences, although more data on behaviour, physiology, and ecology of species are necessary.
If you could study any organism on Earth, what would it be? I would study the King Vulture, or Urubu-Rei (Sarcoramphus papa), from Brazil. This species is, in my opinion, the nicest bird in the world! Its flight is magnificent! It would be great to do fieldwork in the mountain ranges of the State of Minas Gerais in Brazil, where this bird can be found. Observing the King Vulture flying while drinking the best coffee in the world and eating a delicious cheese-bread (pão de queijo) would be priceless.